Xcel Energy 2004 Annual Report Download - page 26
Download and view the complete annual report
Please find page 26 of the 2004 Xcel Energy annual report below. You can navigate through the pages in the report by either clicking on the pages listed below, or by using the keyword search tool below to find specific information within the annual report.-
 1
1 -
2
-
3
-
4
-
5
-
6
-
7
-
8
-
9
-
10
-
11
-
12
-
13
-
14
-
15
-
 16
16 -
 17
17 -
 18
18 -
 19
19 -
 20
20 -
 21
21 -
 22
22 -
 23
23 -
 24
24 -
 25
25 -
 26
26 -
 27
27 -
 28
28 -
 29
29 -
 30
30 -
 31
31 -
 32
32 -
 33
33 -
 34
34 -
 35
35 -
 36
36 -
37
-
38
-
39
-
40
-
41
-
42
-
43
-
44
-
45
-
46
-
47
-
48
-
49
-
50
-
51
-
52
-
53
-
54
-
55
-
56
-
57
-
58
-
59
-
60
-
61
-
62
-
63
-
64
-
65
-
66
-
67
-
68
-
69
-
70
-
71
-
72
-
73
-
74
-
75
-
76
-
77
-
78
-
79
-
80
-
81
-
82
-
83
-
84
-
85
-
86
-
87
-
88
-
89
-
90
 |
 |

MANAGEMENT’S DISCUSSION and ANALYSIS
Xcel Energy Annual Report 2004
24
Planergy Planergy provided energy management services. Planergy’s losses were lower in 2004 due to the dissolution of its business. Its losses were
lower in 2002 largely due to pretax gains of approximately $8 million from the sale of a portfolio of energy management contracts, which reduced
losses by approximately 2 cents per share.
Financing Costs and Preferred Dividends Nonregulated results include interest expense and the earnings-per-share impact of preferred dividends, which
are incurred at the Xcel Energy and intermediate holding company levels, and are not directly assigned to individual subsidiaries.
In November 2002, the Xcel Energy holding company issued temporary financing, which included detachable options for the purchase of Xcel Energy
notes, which were convertible to Xcel Energy common stock. This temporary financing was replaced with long-term holding company financing in late
November 2002. Costs incurred to redeem the temporary financing included a redemption premium of $7.4 million, $5.2 million of debt discount
associated with the detachable option, and other issuance costs, which increased financing costs and reduced 2002 earnings by 2 cents per share.
The earnings-per-share impact of financing costs and preferred dividends for 2004 and 2003 included above reflects dilutive securities, as discussed further
in Note 11 to the Consolidated Financial Statements. The impact of the dilutive securities, if converted, is a reduction of interest expense resulting in an
increase in net income of approximately $15 million, or 4 cents per share, in 2004, and $11 million, or 3 cents per share, in 2003.
Holding Company Special Charges During 2004, special charges at the holding company consisted of an accrual of $17.6 million for a settlement
agreement related to shareholder lawsuits. See Note 2 to the Consolidated Financial Statements for further discussion of these special charges.
During 2002, NRG experienced credit-rating downgrades, defaults under certain credit agreements, increased collateral requirements and reduced liquidity.
These events ultimately led to the restructuring of NRG in late 2002 and its bankruptcy filing in May 2003. See Note 4 to the Consolidated Financial
Statements. Certain costs related to NRG’s restructuring were incurred at the holding company level and included in continuing operations and reported as
Special Charges. Approximately $12 million of these costs were incurred in 2003 and $5 million were incurred in 2002, which reduced after-tax earnings by
approximately 2 cents per share and 1 cent per share, respectively. Costs in 2003 included approximately $32 million of financial advisor fees, legal costs
and consulting costs related to the NRG bankruptcy transaction. These charges were partially offset by a $20 million pension curtailment gain related
to the termination of NRG employees from Xcel Energy’s pension plan. In 2003, Xcel Energy also recorded a $7 million charge in connection with
the suspension of the formation of the independent transmission company TRANSLink. See Note 2 to the Consolidated Financial Statements for
further discussion of these special charges.
Other Nonregulated In 2003, Utility Engineering sold water rights, resulting in a pretax gain (reported as nonoperating income) of $15 million. The
gain increased after-tax income by approximately 2 cents per share.
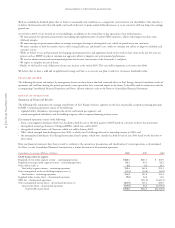
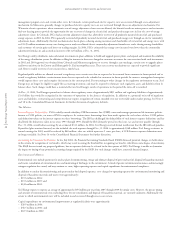
Statement of Operations Analysis – Discontinued Operations
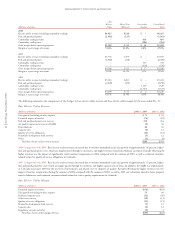
A summary of the various components of discontinued operations is as follows for the years ended Dec. 31:
(Millions of dollars) 2004 2003 2002
Income (loss)
Viking Gas Transmission Co. $ 1.3 $ 21.9 $ 9.4
Black Mountain Gas –2.4 1.0
Cheyenne Light, Fuel and Power Co. (10.3) 2.5 3.4
Regulated utility segments – income (loss) (9.0) 26.8 13.8
NRG segment – loss –(251.4) (3,444.1)
Xcel Energy International 7.3 (45.5) (17.1)
e prime (1.8) (17.8) 1.5
Seren Innovations (156.5) (18.3) (27.1)
Other 1.9 (1.6) (2.4)
NRG-related tax benefits (expense) (12.8) 404.4 706.0
Nonregulated/other – income (loss) (161.9) 321.2 660.9
Total income (loss) from discontinued operations $(170.9) $ 96.6 $(2,769.4)
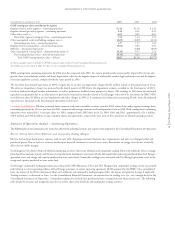
Income (loss) per share
Viking Gas Transmission Co. $– $ 0.05 $ 0.03
Black Mountain Gas –0.01 –
Cheyenne Light, Fuel and Power Co. (0.02) – –
Regulated utility segments – income per share (loss) (0.02) 0.06 0.03
NRG segment – loss per share –(0.60) (8.95)
Xcel Energy International 0.02 (0.11) (0.05)
e prime –(0.04) –
Seren Innovations (0.37) (0.04) (0.07)
Other ––0.01
NRG-related tax benefits (expense) (0.03) 0.96 1.83
Nonregulated/other – income (loss) per share (0.38) 0.77 1.72
Total income (loss) per share from discontinued operations $ (0.40) $ 0.23 $ (7.20)