Xcel Energy 2004 Annual Report Download - page 23
Download and view the complete annual report
Please find page 23 of the 2004 Xcel Energy annual report below. You can navigate through the pages in the report by either clicking on the pages listed below, or by using the keyword search tool below to find specific information within the annual report.-
 1
1 -
2
-
3
-
4
-
5
-
6
-
7
-
8
-
9
-
10
-
11
-
12
-
 13
13 -
 14
14 -
 15
15 -
 16
16 -
 17
17 -
 18
18 -
 19
19 -
 20
20 -
 21
21 -
 22
22 -
 23
23 -
 24
24 -
 25
25 -
 26
26 -
 27
27 -
 28
28 -
 29
29 -
 30
30 -
 31
31 -
 32
32 -
 33
33 -
34
-
35
-
36
-
37
-
38
-
39
-
40
-
41
-
42
-
43
-
44
-
45
-
46
-
47
-
48
-
49
-
50
-
51
-
52
-
53
-
54
-
55
-
56
-
57
-
58
-
59
-
60
-
61
-
62
-
63
-
64
-
65
-
66
-
67
-
68
-
69
-
70
-
71
-
72
-
73
-
74
-
75
-
76
-
77
-
78
-
79
-
80
-
81
-
82
-
83
-
84
-
85
-
86
-
87
-
88
-
89
-
90
 |
 |

MANAGEMENT’S DISCUSSION and ANALYSIS
Xcel Energy Annual Report 2004
21
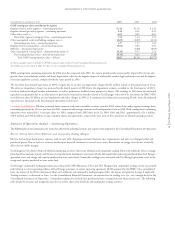
2004 Comparison to 2003 Base electric utility margin decreased due to the impact of weather, higher purchased capacity costs associated with new
contracts to support growth, higher fuel and purchased energy costs not recovered through direct pass-through recovery mechanisms, mainly in Wisconsin,
and regulatory accruals associated with potential customer refunds related to service quality obligations in Colorado and fuel reconciliation proceedings
in Texas. These decreases were partially offset by weather-normalized sales growth.
2003 Comparison to 2002 Base electric utility margin decreased due mainly to higher purchased capacity costs associated with new contracts to support
growth, the allowed recovery of fuel and purchased power costs in excess of actual costs in 2002 under the sharing provisions of the incentive cost
adjustment mechanism in Colorado, compared with passing through costs with no sharing provisions under the interim adjustment clause in 2003,
and the impact of weather. Also decreasing margin were 2003 rate reductions related to lower property taxes in Minnesota and estimated refunds to
customers related to service quality requirements in Colorado. The decreases were partially offset by weather-normalized sales growth, the implementation
of the AQIR and higher capacity sales, as previously discussed.
Short-Term Wholesale and Commodity Trading Margin
2004 Comparison to 2003 Short-term wholesale and commodity trading margins increased approximately $33 million in 2004 compared with 2003.
The increase reflects a number of market factors, including higher market prices, additional resources available for sale and a pre-existing contract,
which provided approximately $17 million of short-term wholesale margins in 2004 and expired in the first quarter of 2004.
2003 Comparison to 2002 Short-term wholesale and commodity trading margins increased approximately $43 million in 2003 compared with 2002.
The increase reflects more favorable market conditions in the northern regions.
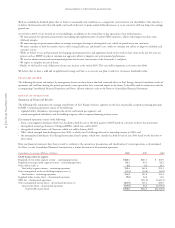
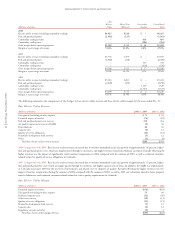
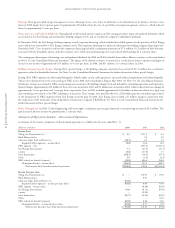
Natural Gas Utility Margins
The following table details the changes in natural gas utility revenue and margin. The cost of natural gas tends to vary with changing sales requirements and
the unit cost of wholesale natural gas purchases. However, due to purchased natural gas cost recovery mechanisms for sales to retail customers, fluctuations
in the wholesale cost of natural gas have little effect on natural gas margin.
(Millions of dollars) 2004 2003 2002
Natural gas utility revenue $1,924 $1,685 $1,341
Cost of natural gas purchased and transported (1,446) (1,191) (838)
Natural gas utility margin $ 478 $ 494 $ 503
The following summarizes the components of the changes in natural gas revenue and margin for the years ended Dec. 31:
Natural Gas Revenue
(Millions of dollars) 2004 vs. 2003 2003 vs. 2002
Sales growth (excluding weather impact) $ (3) $15
Purchased natural gas adjustment clause recovery 257 346
Rate changes – Colorado (15) (14)
Estimated impact of weather (10) –
Transportation and other 10 (3)
Total natural gas revenue increase $239 $344
2004 Comparison to 2003 Natural gas revenue increased primarily due to higher natural gas costs in 2004, which are passed through to customers.
Retail natural gas weather-normalized sales declined in 2004, largely due to the rising cost of natural gas and its impact on customer usage.
2003 Comparison to 2002 Natural gas revenue increased mainly due to higher natural gas costs in 2003, which are passed through to customers.
Natural Gas Margin
(Millions of dollars) 2004 vs. 2003 2003 vs. 2002
Sales growth (excluding weather impact) $ – $5
Estimated impact of weather on firm sales volume (5) (4)
Rate changes – Colorado (15) (14)
Transportation and other 44
Total natural gas margin decrease $(16) $(9)
2004 Comparison to 2003 Natural gas margin decreased due to a full year of the base rate decrease, which was effective July 1, 2003, agreed to in the
settlement of the PSCo 2002 general rate case and the impact of warmer winter temperatures in 2004 compared with 2003. The rate case settlement
agreement is discussed further under Factors Affecting Results of Continuing Operations.
2003 Comparison to 2002 Natural gas margin decreased due to the rate decrease discussed above and the impact of warmer winter temperatures in
2003 compared with 2002. The rate case settlement agreement is discussed further under Factors Affecting Results of Continuing Operations.