Xcel Energy 2004 Annual Report Download - page 64
Download and view the complete annual report
Please find page 64 of the 2004 Xcel Energy annual report below. You can navigate through the pages in the report by either clicking on the pages listed below, or by using the keyword search tool below to find specific information within the annual report.-
 1
1 -
2
-
3
-
4
-
5
-
6
-
7
-
8
-
9
-
10
-
11
-
12
-
13
-
14
-
15
-
16
-
17
-
18
-
19
-
20
-
21
-
22
-
23
-
24
-
25
-
26
-
27
-
28
-
29
-
30
-
31
-
32
-
33
-
34
-
35
-
36
-
37
-
38
-
39
-
40
-
41
-
42
-
43
-
44
-
45
-
46
-
47
-
48
-
49
-
50
-
51
-
52
-
53
-
 54
54 -
 55
55 -
 56
56 -
 57
57 -
 58
58 -
 59
59 -
 60
60 -
 61
61 -
 62
62 -
 63
63 -
 64
64 -
 65
65 -
 66
66 -
 67
67 -
 68
68 -
 69
69 -
 70
70 -
 71
71 -
 72
72 -
 73
73 -
 74
74 -
75
-
76
-
77
-
78
-
79
-
80
-
81
-
82
-
83
-
84
-
85
-
86
-
87
-
88
-
89
-
90
 |
 |

NOTES to CONSOLIDATED FINANCIAL STATEMENTS
Xcel Energy Annual Report 2004
62
On March 28, 2003, the governance, compensation and nominating committee of Xcel Energy’s board of directors granted restricted stock units and
performance shares under the Xcel Energy Inc. Omnibus Incentive Plan approved by the shareholders in 2000. Restrictions on the restricted stock units
lapse upon the achievement of a 27-percent total shareholder return (TSR) for 10 consecutive business days and other criteria relating to Xcel Energy’s
common equity ratio. Under no circumstances will the restrictions lapse until one year after the grant date. TSR is measured using the market price
per share of Xcel Energy common stock, which at the grant date was $12.93, plus common dividends declared after grant date. The TSR was met in
the fourth quarter of 2003, and approximately $31 million of compensation expense was recorded at Dec. 31, 2003. The remaining cost of $10 million
related to the 2003 restricted stock units was recorded in the first quarter of 2004. In January 2004, Xcel Energy’s board of directors approved the
repurchase of up to 2.5 million shares of common stock to fulfill the requirements of the restricted stock unit exercise. On March 29, 2004, the restricted
stock units lapsed, and Xcel Energy issued approximately 1.6 million shares of common stock.
On Dec. 9, 2003, the governance, compensation and nominating committee of Xcel Energy’s board of directors approved restricted stock units
and performance shares under the Xcel Energy Inc. Omnibus Incentive Plan. On Jan. 2, 2004, Xcel Energy granted 836,186 restricted stock units
and performance shares. The grant-date market price used to calculate the TSR for this grant is $17.03. No expense has been recorded for the 2004
restricted stock units as it is not currently probable they will be earned.
On Dec. 14, 2004, the governance, compensation and nominating committee of Xcel Energy’s board of directors approved restricted stock units
and performance shares under the Xcel Energy Inc. Omnibus Incentive Plan. On Jan. 1, 2005, Xcel Energy granted 843,251 restricted stock units and
performance shares. The grant-date market price used to calculate the TSR for this grant is $18.10.
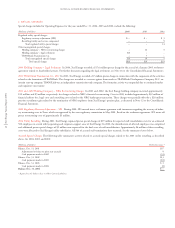
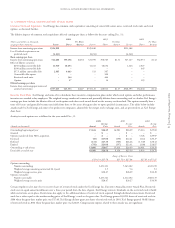
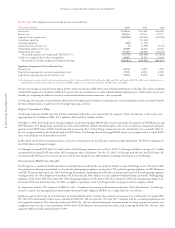
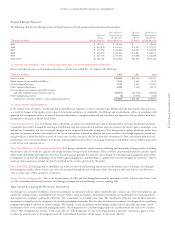
Xcel Energy applies Accounting Principles Board Opinion No. 25 – “Accounting for Stock Issued to Employees” in accounting for stock-based compensation
and, accordingly, no compensation cost is recognized for the issuance of stock options, as the exercise price of the options equals the fair-market value of
Xcel Energy’s common stock at the date of grant. In December 2002, the FASB issued SFAS No. 148 – “Accounting for Stock-Based Compensation –
Transition and Disclosure,” amending SFAS No. 123 to provide alternative methods of transition for a voluntary change to the fair-value-based method
of accounting for stock-based employee compensation, and requiring disclosure in both annual and interim Consolidated Financial Statements about
the method used and the effect of the method used on results. The pro forma impact of applying SFAS No. 148 is as follows at Dec. 31:
(Thousands of dollars, except per share amounts) 2004 2003 2002
Net income (loss) – as reported $355,961 $622,392 $(2,217,991)
Less: Total stock-based employee compensation expense determined under
fair-value-based method for all awards, net of related tax effects (2,339) (3,897) (6,959)
Pro forma net income (loss) $353,622 $618,495 $(2,224,950)
Earnings (loss) per share:
Basic – as reported $ 0.88 $ 1.55 $ (5.82)
Basic – pro forma $ 0.87 $ 1.54 $ (5.84)
Diluted – as reported $ 0.87 $ 1.50 $ (5.77)
Diluted – pro forma $ 0.86 $ 1.49 $ (5.79)
Common Stock Dividends Per Share Historically, Xcel Energy has paid quarterly dividends to its shareholders. For the first quarter of 2004, Xcel Energy
paid dividends to its shareholders of $0.1875 per share. In each of the last three quarters of 2004, Xcel Energy paid dividends to its shareholders of
$0.2075. For each of the four quarters of 2003, Xcel Energy paid dividends to its shareholders of $0.1875 per share. For each of the first two quarters of
2002, Xcel Energy paid dividends to its shareholders of $0.375 per share. In each of the third and fourth quarters of 2002, Xcel Energy paid dividends
to its shareholders of $0.1875 per share. Dividends on common stock are paid as declared by the board of directors.