Xcel Energy 2004 Annual Report Download - page 20
Download and view the complete annual report
Please find page 20 of the 2004 Xcel Energy annual report below. You can navigate through the pages in the report by either clicking on the pages listed below, or by using the keyword search tool below to find specific information within the annual report.-
 1
1 -
2
-
3
-
4
-
5
-
6
-
7
-
8
-
9
-
 10
10 -
 11
11 -
 12
12 -
 13
13 -
 14
14 -
 15
15 -
 16
16 -
 17
17 -
 18
18 -
 19
19 -
 20
20 -
 21
21 -
 22
22 -
 23
23 -
 24
24 -
 25
25 -
 26
26 -
 27
27 -
 28
28 -
 29
29 -
 30
30 -
31
-
32
-
33
-
34
-
35
-
36
-
37
-
38
-
39
-
40
-
41
-
42
-
43
-
44
-
45
-
46
-
47
-
48
-
49
-
50
-
51
-
52
-
53
-
54
-
55
-
56
-
57
-
58
-
59
-
60
-
61
-
62
-
63
-
64
-
65
-
66
-
67
-
68
-
69
-
70
-
71
-
72
-
73
-
74
-
75
-
76
-
77
-
78
-
79
-
80
-
81
-
82
-
83
-
84
-
85
-
86
-
87
-
88
-
89
-
90
 |
 |

MANAGEMENT’S DISCUSSION and ANALYSIS
Xcel Energy Annual Report 2004
18
We have established a dividend policy that we believe is sustainable and contributes to a competitive total return for our shareholders. Our objective is
to deliver the financial results that will enable our board of directors to grant annual dividend increases at a rate consistent with our long-term earnings
growth rate.
As we look to 2005, we are focused on several challenges, in addition to the normal day-to-day operations of our utility business.
– We must prepare for operational uncertainty surrounding the implementation of various FERC initiatives, which could impact our short-term
wholesale margins.
– We must manage our procurement efforts to attempt to mitigate the impact of rising fuel costs, which are passed on to our customers.
– We must continue to look for creative ways to offset rising health care and benefit costs, while we continue our efforts to improve reliability and
customer service.
– While we believe we are well positioned for changing environmental rules and regulations based on the work we have done in the last few years on
projects such as MERP, we plan to continue our aggressive efforts to improve our environmental performance.
– We need to obtain uncontested environmental permits for the new construction of the Comanche 3 coal plant.
– We expect to complete the sale of Seren.
– Finally, we will need to seek a Minnesota electric rate increase at the end of 2005. This case will be important as we move into 2006.
We believe that we have a solid and straightforward strategy and that, as we execute our plan, it will serve to increase shareholder value.
FINANCIAL REVIEW
The following discussion and analysis by management focuses on those factors that had a material effect on Xcel Energy’s financial condition, results of
operations and cash flows during the periods presented, or are expected to have a material impact in the future. It should be read in conjunction with the
accompanying Consolidated Financial Statements and Notes. All note references refer to the Notes to Consolidated Financial Statements.
RESULTS OF OPERATIONS
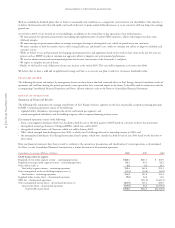
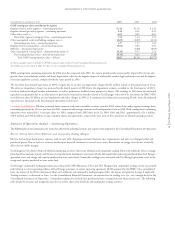
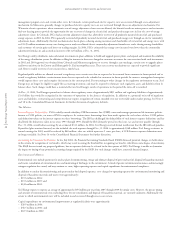
Summary of Financial Results
The following table summarizes the earnings contributions of Xcel Energy’s business segments on the basis of generally accepted accounting principles
(GAAP). Continuing operations consist of the following:
– regulated utility subsidiaries, operating in the electric and natural gas segments; and
– several nonregulated subsidiaries and the holding company, where corporate financing activity occurs.
Discontinued operations consist of the following:
– Seren, a nonregulated subsidiary, which was classified as held for sale in the third quarter of 2004 based on a decision to divest this investment;
– the regulated natural gas businesses Viking and BMG, which were sold in 2003;
– the regulated utility business of Cheyenne, which was sold in January 2005;
– NRG, which emerged from bankruptcy in late 2003, at which time Xcel Energy divested its ownership interest in NRG; and
– the nonregulated subsidiaries Xcel Energy International and e prime, which were classified as held for sale in late 2003 based on the decision to
divest them.
Prior-year financial statements have been restated to conform to the current-year presentation and classification of certain operations as discontinued.
See Note 3 to the Consolidated Financial Statements for a further discussion of discontinued operations.
Contribution to earnings (Millions of dollars) 2004 2003 2002
GAAP income (loss) by segment
Regulated electric utility segment income – continuing operations $466.3 $461.3 $ 484.9
Regulated natural gas utility segment income – continuing operations 86.1 94.1 88.2
Other utility results (a) 6.0 6.4 20.1
Total utility segment income – continuing operations 558.4 561.8 593.2
Other nonregulated results and holding company costs (a) (31.5) (36.0) (41.8)
Total income – continuing operations 526.9 525.8 551.4
Regulated utility income (loss) – discontinued operations (9.0) 26.8 13.8
NRG loss – discontinued operations –(251.4) (3,444.1)
Other nonregulated income (loss) – discontinued operations (b) (161.9) 321.2 660.9
Total income (loss) – discontinued operations (170.9) 96.6 (2,769.4)
Total GAAP income (loss) $356.0 $622.4 $(2,218.0)