Xcel Energy 2004 Annual Report Download - page 46
Download and view the complete annual report
Please find page 46 of the 2004 Xcel Energy annual report below. You can navigate through the pages in the report by either clicking on the pages listed below, or by using the keyword search tool below to find specific information within the annual report.-
 1
1 -
2
-
3
-
4
-
5
-
6
-
7
-
8
-
9
-
10
-
11
-
12
-
13
-
14
-
15
-
16
-
17
-
18
-
19
-
20
-
21
-
22
-
23
-
24
-
25
-
26
-
27
-
28
-
29
-
30
-
31
-
32
-
33
-
34
-
35
-
 36
36 -
 37
37 -
 38
38 -
 39
39 -
 40
40 -
 41
41 -
 42
42 -
 43
43 -
 44
44 -
 45
45 -
 46
46 -
 47
47 -
 48
48 -
 49
49 -
 50
50 -
 51
51 -
 52
52 -
 53
53 -
 54
54 -
 55
55 -
 56
56 -
57
-
58
-
59
-
60
-
61
-
62
-
63
-
64
-
65
-
66
-
67
-
68
-
69
-
70
-
71
-
72
-
73
-
74
-
75
-
76
-
77
-
78
-
79
-
80
-
81
-
82
-
83
-
84
-
85
-
86
-
87
-
88
-
89
-
90
 |
 |

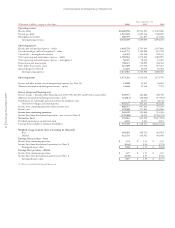
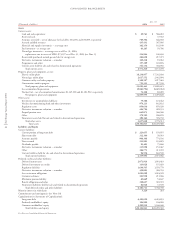
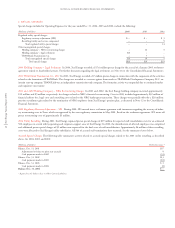
CONSOLIDATED BALANCE SHEETS
Xcel Energy Annual Report 2004
44
Dec. 31
(Thousands of dollars) 2004 2003
Assets
Current assets:
Cash and cash equivalents $ 29,761 $ 568,283
Restricted cash –37,363
Accounts receivable – net of allowance for bad debts: $34,694 and $30,899, respectively 769,302 646,638
Accrued unbilled revenues 435,431 367,005
Materials and supplies inventories – at average cost 162,150 162,140
Fuel inventory – at average cost 64,265 59,706
Natural gas inventories – at average cost as of Dec. 31, 2004;
replacement cost in excess of LIFO: $73,197 as of Dec. 31, 2003 (see Note 1) 214,964 140,636
Recoverable purchased natural gas and electric energy costs 264,628 217,473
Derivative instruments valuation – at market 129,218 93,063
Prepayments and other 157,389 110,876
Current assets held for sale and related to discontinued operations 344,132 728,056
Total current assets 2,571,240 3,131,239
Property, plant and equipment, at cost:
Electric utility plant 18,236,957 17,242,636
Natural gas utility plant 2,617,552 2,442,994
Common utility and other property 1,509,597 1,217,461
Construction work in progress 721,335 917,530
Total property, plant and equipment 23,085,441 21,820,621
Less accumulated depreciation (9,063,794) (8,605,082)
Nuclear fuel – net of accumulated amortization: $1,145,228 and $1,101,932, respectively 74,308 80,289
Net property, plant and equipment 14,095,955 13,295,828
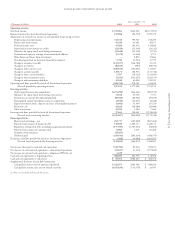
Other assets:
Investments in unconsolidated affiliates 79,386 124,462
Nuclear decommissioning fund and other investments 970,213 842,832
Regulatory assets 850,636 879,320
Derivative instruments valuation – at market 424,786 429,531
Prepaid pension asset 642,873 566,568
Other 179,592 206,870
Noncurrent assets held for sale and related to discontinued operations 490,162 728,730
Total other assets 3,637,648 3,778,313
Total assets $20,304,843 $20,205,380
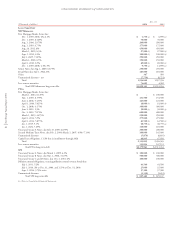
Liabilities and Equity
Current liabilities:
Current portion of long-term debt $ 223,655 $ 159,955
Short-term debt 312,300 58,563
Accounts payable 906,308 774,336
Taxes accrued 211,901 193,895
Dividends payable 83,405 75,866
Derivative instruments valuation – at market 135,098 153,467
Other 366,771 411,435
Current liabilities held for sale and related to discontinued operations 96,556 843,549
Total current liabilities 2,335,994 2,671,066
Deferred credits and other liabilities:
Deferred income taxes 2,071,914 1,991,483
Deferred investment tax credits 143,028 155,629
Regulatory liabilities 1,630,545 1,559,779
Derivative instruments valuation – at market 450,883 388,743
Asset retirement obligations 1,091,089 1,024,529
Customer advances 303,928 211,046
Minimum pension liability 62,669 54,647
Benefit obligations and other 328,627 310,355
Noncurrent liabilities held for sale and related to discontinued operations 82,028 72,549
Total deferred credits and other liabilities 6,164,711 5,768,760
Minority interest in subsidiaries 3,220 281
Commitments and contingencies (see Note 16)
Capitalization (see Statements of Capitalization):
Long-term debt 6,493,020 6,493,853
Preferred stockholders’ equity 104,980 104,980
Common stockholders’ equity 5,202,918 5,166,440
Total liabilities and equity $20,304,843 $20,205,380
See Notes to Consolidated Financial Statements.