Xcel Energy 2004 Annual Report Download - page 35
Download and view the complete annual report
Please find page 35 of the 2004 Xcel Energy annual report below. You can navigate through the pages in the report by either clicking on the pages listed below, or by using the keyword search tool below to find specific information within the annual report.-
 1
1 -
2
-
3
-
4
-
5
-
6
-
7
-
8
-
9
-
10
-
11
-
12
-
13
-
14
-
15
-
16
-
17
-
18
-
19
-
20
-
21
-
22
-
23
-
24
-
 25
25 -
 26
26 -
 27
27 -
 28
28 -
 29
29 -
 30
30 -
 31
31 -
 32
32 -
 33
33 -
 34
34 -
 35
35 -
 36
36 -
 37
37 -
 38
38 -
 39
39 -
 40
40 -
 41
41 -
 42
42 -
 43
43 -
 44
44 -
 45
45 -
46
-
47
-
48
-
49
-
50
-
51
-
52
-
53
-
54
-
55
-
56
-
57
-
58
-
59
-
60
-
61
-
62
-
63
-
64
-
65
-
66
-
67
-
68
-
69
-
70
-
71
-
72
-
73
-
74
-
75
-
76
-
77
-
78
-
79
-
80
-
81
-
82
-
83
-
84
-
85
-
86
-
87
-
88
-
89
-
90
 |
 |

MANAGEMENT’S DISCUSSION and ANALYSIS
Xcel Energy Annual Report 2004
33
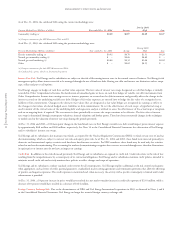
Liquidity and Capital Resources
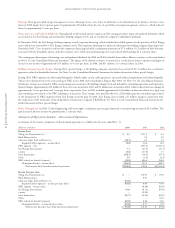
Cash Flows
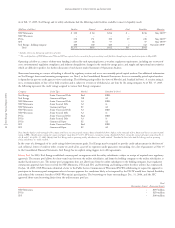
(Millions of dollars) 2004 2003 2002
Cash provided by (used in) operating activities
Continuing operations $1,126 $1,107 $1,282
Discontinued operations (309) 271 433
Tot a l $ 817 $1,378 $1,715
Cash provided by operating activities for continuing operations increased $19 million during 2004 compared with 2003 due to the timing of payments
made for trade payables partially offset by increased inventory costs related to higher natural gas costs, which will be collected from customers in
future periods. Cash provided by operating activities for discontinued operations decreased $580 million during 2004 compared with 2003. During
2004, Xcel Energy paid $752 million pursuant to the NRG settlement agreement, which was partially offset by tax benefits received.
Cash provided by operating activities for continuing operations decreased during 2003 compared with 2002 primarily due to decreases in recovery of deferred
fuel costs. Cash provided by operating activities for discontinued operations decreased during 2003 compared with 2002 due to the de-consolidation of
NRG for 2003 reporting and the exclusion of any of its cash flows in that year. The decrease was partially offset by tax benefits received in connection
with the divestiture of NRG in 2003.
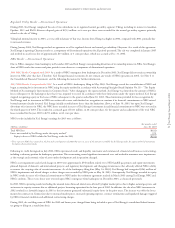
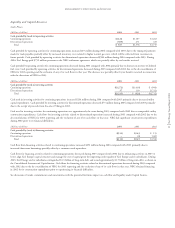
(Millions of dollars) 2004 2003 2002
Cash provided by (used in) investing activities
Continuing operations $(1,272) $(1,036) $ (990)
Discontinued operations 37 110 (1,721)
Tot a l $(1,235) $ (926) $(2,711)
Cash used in investing activities for continuing operations increased $236 million during 2004 compared with 2003 primarily due to increased utility
capital expenditures. Cash provided by investing activities for discontinued operations decreased $73 million during 2004 compared with 2003 primarily
due to the receipt of proceeds from the sale of Viking in 2003.
Cash used in investing activities for continuing operations was approximately the same during 2003 compared with 2002 due to comparable utility
construction expenditures. Cash flows for investing activities related to discontinued operations increased during 2003 compared with 2002 due to the
de-consolidation of NRG for 2003 reporting and the exclusion of any of its cash flows in that year. NRG had significant construction expenditures
during 2002 prior to its financial difficulties.
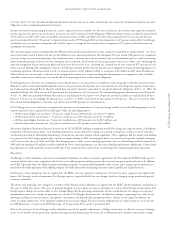
(Millions of dollars) 2004 2003 2002
Cash provided by (used in) financing activities
Continuing operations $(111) $(363) $ 115
Discontinued operations –(4) 1,465
Tot a l $(111) $(367) $1,580
Cash flow from financing activities related to continuing operations increased $252 million during 2004 compared with 2003 primarily due to
increased short-term borrowings partially offset by a common stock repurchase.
Cash flows for financing activities related to continuing operations decreased during 2003 compared with 2002 due to refinancing activities in 2003 to
better align Xcel Energy’s capital structure and manage the cost of capital given the improving credit quality of Xcel Energy and its subsidiaries. During
2003, Xcel Energy and its subsidiaries extinguished $1.3 billion of long-term debt and issued approximately $1.7 billion of long-term debt, as shown in
the Consolidated Statement of Capitalization. Cash flows for financing activities related to discontinued operations decreased during 2003 compared
with 2002 due to the de-consolidation of NRG for 2003 reporting and the exclusion of any of its cash flows in that year. NRG obtained financing
in 2002 for its construction expenditures prior to experiencing its financial difficulties.
See discussion of trends, commitments and uncertainties with the potential for future impact on cash flow and liquidity under Capital Sources.