Xcel Energy 2004 Annual Report Download - page 62
Download and view the complete annual report
Please find page 62 of the 2004 Xcel Energy annual report below. You can navigate through the pages in the report by either clicking on the pages listed below, or by using the keyword search tool below to find specific information within the annual report.-
 1
1 -
2
-
3
-
4
-
5
-
6
-
7
-
8
-
9
-
10
-
11
-
12
-
13
-
14
-
15
-
16
-
17
-
18
-
19
-
20
-
21
-
22
-
23
-
24
-
25
-
26
-
27
-
28
-
29
-
30
-
31
-
32
-
33
-
34
-
35
-
36
-
37
-
38
-
39
-
40
-
41
-
42
-
43
-
44
-
45
-
46
-
47
-
48
-
49
-
50
-
51
-
 52
52 -
 53
53 -
 54
54 -
 55
55 -
 56
56 -
 57
57 -
 58
58 -
 59
59 -
 60
60 -
 61
61 -
 62
62 -
 63
63 -
 64
64 -
 65
65 -
 66
66 -
 67
67 -
 68
68 -
 69
69 -
 70
70 -
 71
71 -
 72
72 -
73
-
74
-
75
-
76
-
77
-
78
-
79
-
80
-
81
-
82
-
83
-
84
-
85
-
86
-
87
-
88
-
89
-
90
 |
 |

NOTES to CONSOLIDATED FINANCIAL STATEMENTS
Xcel Energy Annual Report 2004
60
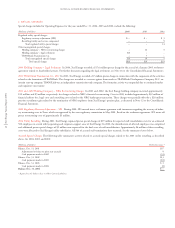
10. INCOME TAXES
Xcel Energy’s share of NRG results for current and prior periods is shown as a component of discontinued operations, due to NRG’s emergence from
bankruptcy in December 2003 and Xcel Energy’s corresponding divestiture of its ownership interest in NRG. Accordingly, Xcel Energy’s tax benefits
related to its investment in NRG are reported in discontinued operations.
Xcel Energy’s federal net operating loss and tax credit carry forwards are estimated to be $1.4 billion and $79 million, respectively. $1.2 billion of the
net operating loss and $23 million of the tax credit carry forwards are accounted for in discontinued operations. The carry forward periods expire in
2023 and 2024. Xcel Energy also has a net operating loss carry forward in some states. The state carry forward periods expire between 2018 and 2024.
A valuation allowance was recorded against $46 million of capital loss carry forwards related to the sales of Xcel Energy International subsidiaries, which
are accounted for in discontinued operations. The capital loss carry forward period expires in 2009.
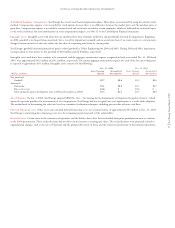
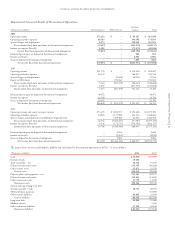
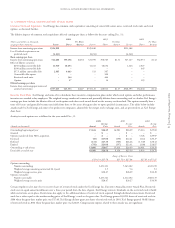
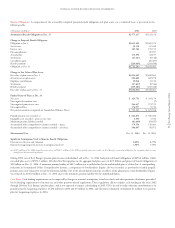
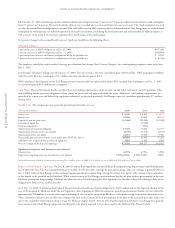
Total income tax expense from continuing operations differs from the amount computed by applying the statutory federal income tax rate to income before
income tax expense. The following is a table reconciling such differences:
2004 2003 2002
Federal statutory rate 35.0% 35.0% 35.0%
Increases (decreases) in tax from:
State income taxes, net of federal income tax benefit 3.3 2.2 3.2
Life insurance policies (4.0) (3.7) (3.2)
Tax credits recognized (4.5) (4.0) (4.5)
Regulatory differences – utility plant items (0.1) 0.8 1.5
Resolution of income tax audits and prior period adjustments (5.3) (5.0) –
Other – net (1.2) (0.7) (1.2)
Effective income tax rate from continuing operations 23.2% 24.6% 30.8%
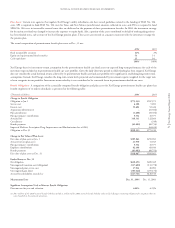
Income taxes comprise the following expense (benefit) items:
(Thousands of dollars) 2004 2003 2002
Current federal tax expense $108,857 $126,828 $117,430
Current state tax expense (benefit) 35,733 (1,170) 22,149
Current tax credits (18,303) (15,268) (19,079)
Deferred federal tax expense 45,172 70,153 124,537
Deferred state tax expense 316 3,298 17,435
Deferred investment tax credits (12,189) (12,440) (16,626)
Total income tax expense from continuing operations $159,586 $171,401 $245,846
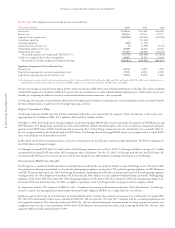
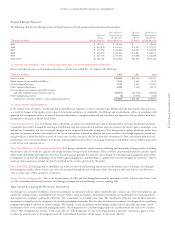
The components of Xcel Energy’s net deferred tax liability from continuing operations (current and noncurrent portions) at Dec. 31 were:
(Thousands of dollars) 2004 2003
Deferred tax liabilities:
Differences between book and tax bases of property $2,056,777 $1,810,220
Regulatory assets 244,388 243,590
Employee benefits 32,658 102,142
Partnership income/loss 22,374 32,145
Service contracts 11,369 18,757
Other 29,311 29,016
Total deferred tax liabilities $2,396,877 $2,235,870
Deferred tax assets:
Net operating loss carry forward $ 90,187 $ 28,846
Other comprehensive income 63,876 54,648
Deferred investment tax credits 55,967 61,070
Tax credit carry forward 51,046 11,668
Regulatory liabilities 39,415 44,284
Book reverses and other 71,649 36,698
Total deferred tax assets $ 372,140 $ 237,214
Net deferred tax liability $2,024,737 $1,998,656