Xcel Energy 2004 Annual Report Download - page 66
Download and view the complete annual report
Please find page 66 of the 2004 Xcel Energy annual report below. You can navigate through the pages in the report by either clicking on the pages listed below, or by using the keyword search tool below to find specific information within the annual report.-
 1
1 -
2
-
3
-
4
-
5
-
6
-
7
-
8
-
9
-
10
-
11
-
12
-
13
-
14
-
15
-
16
-
17
-
18
-
19
-
20
-
21
-
22
-
23
-
24
-
25
-
26
-
27
-
28
-
29
-
30
-
31
-
32
-
33
-
34
-
35
-
36
-
37
-
38
-
39
-
40
-
41
-
42
-
43
-
44
-
45
-
46
-
47
-
48
-
49
-
50
-
51
-
52
-
53
-
54
-
55
-
 56
56 -
 57
57 -
 58
58 -
 59
59 -
 60
60 -
 61
61 -
 62
62 -
 63
63 -
 64
64 -
 65
65 -
 66
66 -
 67
67 -
 68
68 -
 69
69 -
 70
70 -
 71
71 -
 72
72 -
 73
73 -
 74
74 -
 75
75 -
 76
76 -
77
-
78
-
79
-
80
-
81
-
82
-
83
-
84
-
85
-
86
-
87
-
88
-
89
-
90
 |
 |

NOTES to CONSOLIDATED FINANCIAL STATEMENTS
Xcel Energy Annual Report 2004
64
12. BENEFIT PLANS AND OTHER POSTRETIREMENT BENEFITS
Xcel Energy offers various benefit plans to its benefit employees. Approximately 51 percent of benefiting employees are represented by several local
labor unions under several collective-bargaining agreements. At Dec. 31, 2004, NSP-Minnesota had 2,197 and NSP-Wisconsin had 414 bargaining
employees covered under a collective-bargaining agreement, which expires at the end of 2007. PSCo had 2,177 bargaining employees covered under
a collective-bargaining agreement, which expires in May 2006. SPS had 739 bargaining employees covered under a collective-bargaining agreement,
which expires in October 2005.
Pension Benefits
Xcel Energy has several noncontributory, defined benefit pension plans that cover almost all employees. Benefits are based on a combination of years of
service, the employee’s average pay and Social Security benefits.
Xcel Energy’s policy is to fully fund into an external trust the actuarially determined pension costs recognized for ratemaking and financial reporting
purposes, subject to the limitations of applicable employee benefit and tax laws.
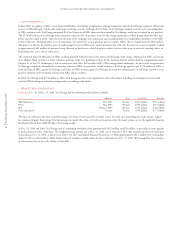
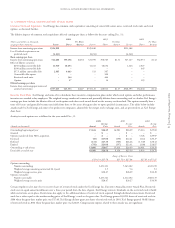
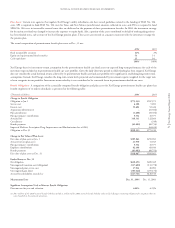
Pension Plan Assets Plan assets principally consist of the common stock of public companies, corporate bonds and U.S. government securities. In 2004,
Xcel Energy completed a review of its pension plan asset allocation and adopted revised asset allocation targets. The target range for our pension
asset allocation is 60 percent in equity investments, 20 percent in fixed income investments, no cash investments and 20 percent in nontraditional
investments, such as real estate, timber ventures, private equity and a diversified commodities index.
The actual composition of pension plan assets at Dec. 31 was:
2004 2003
Equity securities 69% 75%
Debt securities 19 14
Real estate 43
Cash 1–
Nontraditional investments 78
100% 100%
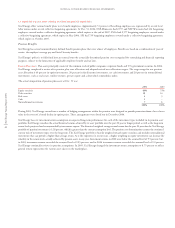
During 2003, Xcel Energy entered into a number of hedging arrangements within the pension trust designed to provide protection from a loss of asset
value in the event of a broad decline in equity prices. These arrangements were closed out in December 2004.
Xcel Energy bases its investment-return assumption on expected long-term performance for each of the investment types included in its pension asset
portfolio. Xcel Energy considers the actual historical returns achieved by its asset portfolio over the past 20-year or longer period, as well as the long-term
return levels projected and recommended by investment experts. The historical weighted average annual return for the past 20 years for the Xcel Energy
portfolio of pension investments is 12.8 percent, which is greater than the current assumption level. The pension cost determinations assume the continued
current mix of investment types over the long term. The Xcel Energy portfolio is heavily weighted toward equity securities and includes nontraditional
investments that can provide a higher-than-average return. As is the experience in recent years, a higher weighting in equity investments can increase the
volatility in the return levels actually achieved by pension assets in any year. Investment returns in 2002 were below the assumed level of 9.5 percent, but
in 2003 investment returns exceeded the assumed level of 9.25 percent, and in 2004 investment returns exceeded the assumed level of 9.0 percent.
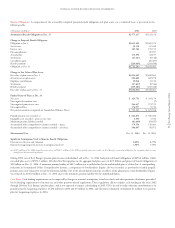
Xcel Energy continually reviews its pension assumptions. In 2005, Xcel Energy changed the investment-return assumption to 8.75 percent to reflect
general return expectations for various asset classes in the marketplace.