Xcel Energy 2004 Annual Report Download - page 47
Download and view the complete annual report
Please find page 47 of the 2004 Xcel Energy annual report below. You can navigate through the pages in the report by either clicking on the pages listed below, or by using the keyword search tool below to find specific information within the annual report.-
 1
1 -
2
-
3
-
4
-
5
-
6
-
7
-
8
-
9
-
10
-
11
-
12
-
13
-
14
-
15
-
16
-
17
-
18
-
19
-
20
-
21
-
22
-
23
-
24
-
25
-
26
-
27
-
28
-
29
-
30
-
31
-
32
-
33
-
34
-
35
-
36
-
 37
37 -
 38
38 -
 39
39 -
 40
40 -
 41
41 -
 42
42 -
 43
43 -
 44
44 -
 45
45 -
 46
46 -
 47
47 -
 48
48 -
 49
49 -
 50
50 -
 51
51 -
 52
52 -
 53
53 -
 54
54 -
 55
55 -
 56
56 -
 57
57 -
58
-
59
-
60
-
61
-
62
-
63
-
64
-
65
-
66
-
67
-
68
-
69
-
70
-
71
-
72
-
73
-
74
-
75
-
76
-
77
-
78
-
79
-
80
-
81
-
82
-
83
-
84
-
85
-
86
-
87
-
88
-
89
-
90
 |
 |

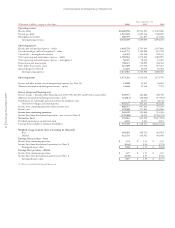
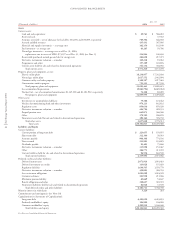
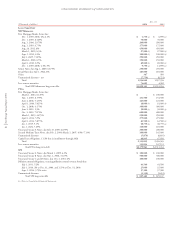
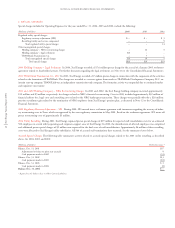
CONSOLIDATED STATEMENTS of COMMON STOCKHOLDERS’ EQUITY and OTHER COMPREHENSIVE INCOME (LOSS)
Xcel Energy Annual Report 2004
45
Accumulated
Common Stock Issued Retained Other Total
Capital in Excess Earnings Shares Held Comprehensive Stockholders’
(Thousands) Shares Par Value of Par Value (Deficit) by ESOP Income (Loss) Equity
Balance at Dec. 31, 2001 345,801 $ 864,503 $2,969,589 $2,558,403 $(18,564) $(179,454) $ 6,194,477
Net loss (2,217,991) (2,217,991)
Currency translation adjustments 30,008 30,008
Minimum pension liability (107,782) (107,782)
Net derivative instrument fair value changes
during the period (see Note 14) (39,475) (39,475)
Unrealized loss – marketable securities (457) (457)
Comprehensive loss for 2002 (2,335,697)
Dividends declared:
Cumulative preferred stock (4,241) (4,241)
Common stock (437,113) (437,113)
Issuances of common stock 27,148 67,870 513,342 581,212
Acquisition of NRG minority common shares 25,765 64,412 555,220 28,150 647,782
Repayment of ESOP loan 18,564 18,564
Balance at Dec. 31, 2002 398,714 $ 996,785 $4,038,151 $ (100,942) $ – $(269,010) $ 4,664,984
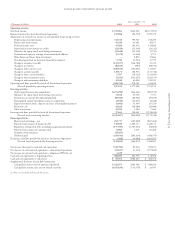
Net income 622,392 622,392
Currency translation adjustments 182,829 182,829
Minimum pension liability 9,710 9,710
Net derivative instrument fair value changes
during the period (see Note 14) (14,005) (14,005)
Unrealized gain – marketable securities 340 340
Comprehensive income for 2003 801,266
Dividends declared:
Cumulative preferred stock (720) (3,181) (3,901)
Common stock (149,521) (149,606) (299,127)
Issuances of common stock 251 627 2,591 3,218
Balance at Dec. 31, 2003 398,965 $ 997,412 $3,890,501 $ 368,663 $ – $ (90,136) $ 5,166,440
Net income 355,961 355,961
Currency translation adjustments (3) (3)
Minimum pension liability (7,935) (7,935)
Net derivative instrument fair value changes
during the period (see Note 14) (8,024) (8,024)
Unrealized gain – marketable securities 164 164
Comprehensive income for 2004 340,163
Dividends declared:
Cumulative preferred stock (4,241) (4,241)
Common stock (323,742) (323,742)
Issuances of common stock 3,297 8,243 48,078 56,321
Purchase for restricted stock issuance (1,800) (4,500) (27,523) (32,023)
Balance at Dec. 31, 2004 400,462 $1,001,155 $3,911,056 $ 396,641 $ – $ (105,934) $5,202,918
See Notes to Consolidated Financial Statements.