Xcel Energy 2004 Annual Report Download - page 24
Download and view the complete annual report
Please find page 24 of the 2004 Xcel Energy annual report below. You can navigate through the pages in the report by either clicking on the pages listed below, or by using the keyword search tool below to find specific information within the annual report.-
 1
1 -
2
-
3
-
4
-
5
-
6
-
7
-
8
-
9
-
10
-
11
-
12
-
13
-
 14
14 -
 15
15 -
 16
16 -
 17
17 -
 18
18 -
 19
19 -
 20
20 -
 21
21 -
 22
22 -
 23
23 -
 24
24 -
 25
25 -
 26
26 -
 27
27 -
 28
28 -
 29
29 -
 30
30 -
 31
31 -
 32
32 -
 33
33 -
 34
34 -
35
-
36
-
37
-
38
-
39
-
40
-
41
-
42
-
43
-
44
-
45
-
46
-
47
-
48
-
49
-
50
-
51
-
52
-
53
-
54
-
55
-
56
-
57
-
58
-
59
-
60
-
61
-
62
-
63
-
64
-
65
-
66
-
67
-
68
-
69
-
70
-
71
-
72
-
73
-
74
-
75
-
76
-
77
-
78
-
79
-
80
-
81
-
82
-
83
-
84
-
85
-
86
-
87
-
88
-
89
-
90
 |
 |

MANAGEMENT’S DISCUSSION and ANALYSIS
Xcel Energy Annual Report 2004
22
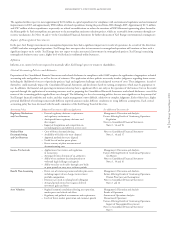
Weather Xcel Energy’s earnings can be significantly affected by weather. Unseasonably hot summers or cold winters increase electric and natural gas
sales, but also can increase expenses. Unseasonably mild weather reduces electric and natural gas sales, but may not reduce expenses, which affects overall
results. The impact of weather on earnings is based on the number of customers, temperature variances and the amount of gas or electricity the average
customer historically has used per degree of temperature.
The following summarizes the estimated impact on the earnings of the utility subsidiaries of Xcel Energy due to temperature variations from historical averages:
– weather in 2004 decreased earnings by an estimated 8 cents per share;
– weather in 2003 had minimal impact on earnings per share; and
– weather in 2002 increased earnings by an estimated 6 cents per share.
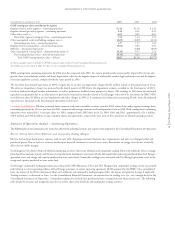
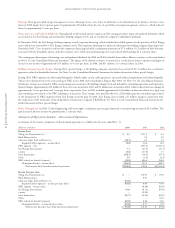
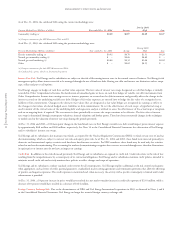
Nonregulated Operating Margins
The following table details the changes in nonregulated revenue and margin included in continuing operations:
(Millions of dollars) 2004 2003 2002
Nonregulated and other revenue $161 $222 $211
Nonregulated cost of goods sold (83) (143) (110)
Nonregulated margin $78 $ 79 $101
2004 Comparison to 2003 Nonregulated revenue decreased in 2004, due primarily to the discontinued consolidation of an investment in an independent
power producing entity that was no longer majority owned.
2003 Comparison to 2002 Nonregulated revenue increased in 2003, due mainly to increased revenues at Utility Engineering. Nonregulated margin
decreased in 2003, due to higher cost of goods sold at a subsidiary of Utility Engineering.
Non-Fuel Operating Expense and Other Items
Other Utility Operating and Maintenance Expenses Other utility operating and maintenance expenses for 2004 increased by approximately $22 million,
or 1.4 percent, compared with 2003. Of the increase, $12 million of increased costs are offset by increased revenue, including those incurred to assist
with the storm damage repair in Florida. The remaining increase of $10 million is primarily due to lower pension credits and higher employee benefit
costs of $31 million, higher electric service reliability costs of $9 million, higher information technology costs of $8 million, higher legal settlement
costs of $7 million, higher plant-related costs of $4 million, higher costs related to a customer billing system conversion of $4 million and $4 million of
increased costs primarily related to compliance with the Sarbanes-Oxley Act of 2002. The higher costs were partially offset by lower compensation costs
of $43 million, lower costs associated with inventory adjustments of $14 million and lower private fuel storage costs of $6 million.
Other utility operating and maintenance expenses increased $90 million, or 6.0 percent, in 2003 compared with 2002. The increase is due primarily to
higher employee-related costs, including higher performance-based compensation of $36 million, restricted stock unit grants of $29 million, lower
pension credits of $19 million and higher medical and health care costs of $9 million. In 2002, there were no restricted stock unit grants and only
a partial award of performance-based compensation. In addition, other utility operating and maintenance expenses for 2003 reflects inventory write-downs
of $8 million, higher uncollectible accounts receivable of $3 million, higher reliability expenses of $6 million and a software project write-off of $2 million.
The increase was partially offset by lower information technology costs resulting from centralization.
Other Nonregulated Operating and Maintenance Expenses Other nonregulated operating and maintenance expenses decreased $14 million, or
19.6 percent, in 2004 compared with 2003. This decrease resulted from the dissolution of Planergy and the discontinued consolidation of an investment
in an independent power producing entity that was no longer majority owned after the divestiture of NRG. See additional discussion of the total results
for each nonregulated subsidiary later.
Other nonregulated operating and maintenance expenses decreased $21 million, or 23.2 percent, in 2003 compared with 2002. The 2002 expenses included
employee severance costs at the holding company. These expenses are included in the results for each nonregulated subsidiary, as discussed later.
Depreciation and Amortization Depreciation and amortization expense for 2004 decreased by approximately $21 million, or 2.8 percent, compared
with 2003, and $18 million, or 2.4 percent, in 2003 compared with 2002. The fluctuations are largely due to several regulatory decisions in 2003. In
2004, as a result of a Minnesota Public Utilities Commission (MPUC) order, NSP-Minnesota modified its decommissioning expense recognition,
which served to reduce decommissioning accruals by approximately $18 million compared with 2003.
In addition, effective July 1, 2003, the Colorado Public Utilities Commission (CPUC) lengthened the depreciable lives of certain electric utility plant at
PSCo as a part of the general Colorado rate case, reducing annual depreciation expense by $20 million. PSCo experienced the full impact of the annual
reduction in 2004, resulting in a decrease in depreciation expense of $10 million for 2004 compared with 2003.
During 2003, the Minnesota Legislature authorized additional spent nuclear fuel storage at the Prairie Island nuclear plant. In December 2003, the
MPUC extended the authorized depreciable lives of the two generating units at the Prairie Island nuclear plant, retroactive to Jan. 1, 2003, reducing
depreciation by $22 million.
Special Charges Special charges in 2004 were $17.6 million related to the settlement of shareholder litigation. Special charges reported in 2003 relate
to the TRANSLink Transmission Co., LLC (TRANSLink) project and NRG restructuring costs. Special charges for 2002 include NRG restructuring