Xcel Energy 2004 Annual Report Download - page 22
Download and view the complete annual report
Please find page 22 of the 2004 Xcel Energy annual report below. You can navigate through the pages in the report by either clicking on the pages listed below, or by using the keyword search tool below to find specific information within the annual report.-
 1
1 -
2
-
3
-
4
-
5
-
6
-
7
-
8
-
9
-
10
-
11
-
 12
12 -
 13
13 -
 14
14 -
 15
15 -
 16
16 -
 17
17 -
 18
18 -
 19
19 -
 20
20 -
 21
21 -
 22
22 -
 23
23 -
 24
24 -
 25
25 -
 26
26 -
 27
27 -
 28
28 -
 29
29 -
 30
30 -
 31
31 -
 32
32 -
33
-
34
-
35
-
36
-
37
-
38
-
39
-
40
-
41
-
42
-
43
-
44
-
45
-
46
-
47
-
48
-
49
-
50
-
51
-
52
-
53
-
54
-
55
-
56
-
57
-
58
-
59
-
60
-
61
-
62
-
63
-
64
-
65
-
66
-
67
-
68
-
69
-
70
-
71
-
72
-
73
-
74
-
75
-
76
-
77
-
78
-
79
-
80
-
81
-
82
-
83
-
84
-
85
-
86
-
87
-
88
-
89
-
90
 |
 |

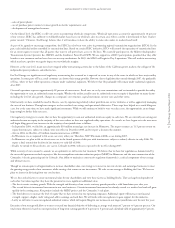
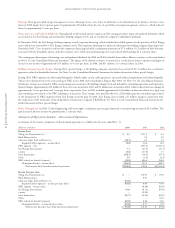
MANAGEMENT’S DISCUSSION and ANALYSIS
Xcel Energy Annual Report 2004
20
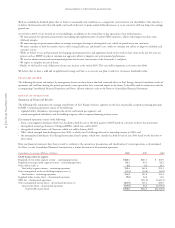
Base
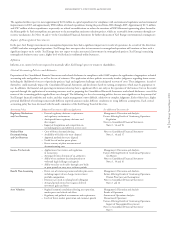
Electric Short-Term Commodity Consolidated
(Millions of dollars) Utility Wholesale Trading Totals
2004
Electric utility revenue (excluding commodity trading) $6,025 $220 $ – $6,245
Fuel and purchased power (2,916) (125) – (3,041)
Commodity trading revenue – – 610 610
Commodity trading costs – – (594) (594)
Gross margin before operating expenses $3,109 $ 95 $ 16 $3,220
Margin as a percentage of revenue 51.6% 43.2% 2.6% 47.0%
2003
Electric utility revenue (excluding commodity trading) $5,756 $179 $ – $5,935
Fuel and purchased power (2,588) (118) – (2,706)
Commodity trading revenue – – 333 333
Commodity trading costs – – (316) (316)
Gross margin before operating expenses $3,168 $ 61 $ 17 $3,246
Margin as a percentage of revenue 55.0% 34.1% 5.1% 51.8%
2002
Electric utility revenue (excluding commodity trading) $5,218 $203 $ – $5,421
Fuel and purchased power (2,028) (170) – (2,198)
Commodity trading revenue – – 1,529 1,529
Commodity trading costs – – (1,527) (1,527)
Gross margin before operating expenses $3,190 $ 33 $ 2 $3,225
Margin as a percentage of revenue 61.1% 16.3% 0.1% 46.4%
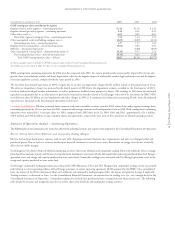
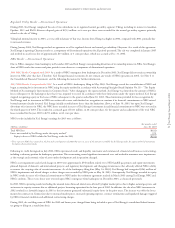
The following summarizes the components of the changes in base electric utility revenue and base electric utility margin for the years ended Dec. 31:
Base Electric Utility Revenue
(Millions of dollars) 2004 vs. 2003 2003 vs. 2002
Sales growth (excluding weather impact) $73 $59
Estimated impact of weather (74) (29)
Fuel and purchased power cost recovery 230 434
Air quality improvement recovery (AQIR) (2) 36
Firm wholesale 62 30
Capacity sales (2) 12
Quality of service obligations (12) (11)
Renewable development fund recovery (5) 12
Other (1) (5)
Total base electric utility revenue increase $269 $538
2004 Comparison with 2003 Base electric utility revenues increased due to weather-normalized retail sales growth of approximately 1.8 percent, higher
fuel and purchased power costs, which are largely passed through to customers, and higher revenues from firm wholesale customers. Partially offsetting the
higher revenues was the impact of significantly cooler summer temperatures in 2004 compared with the summer of 2003, as well as estimated customer
refunds related to quality-of-service obligations in Colorado.
2003 Comparison with 2002 Base electric utility revenues increased due to weather-normalized retail sales growth of approximately 1.5 percent, higher
fuel and purchased power costs, which are largely passed through to customers, and higher capacity sales in Texas. In addition, the AQIR was implemented
in Colorado in January 2003 for the recovery of investments and related costs to improve air quality. Partially offsetting the higher revenues was the
impact of warmer temperatures during the summer of 2002 compared with the summer of 2003, as well as 2003 rate reductions related to lower property
taxes in Minnesota and estimated customer refunds related to service quality requirements in Colorado.
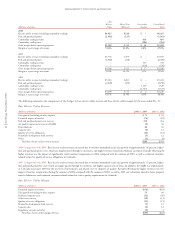
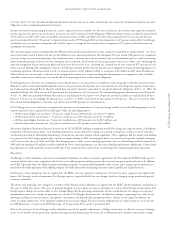
Base Electric Utility Margin
(Millions of dollars) 2004 vs. 2003 2003 vs. 2002
Estimated impact of weather $(56) $(23)
Sales growth (excluding weather impact) 55 48
Purchased capacity costs (12) (50)
Other cost recovery (18) (13)
Quality of service obligations (12) (11)
Renewable development fund recovery (5) 12
Capacity sales (2) 12
Regulatory accruals and other (9) 3
Total base electric utility margin decrease $(59) $(22)