Xcel Energy 2004 Annual Report Download - page 63
Download and view the complete annual report
Please find page 63 of the 2004 Xcel Energy annual report below. You can navigate through the pages in the report by either clicking on the pages listed below, or by using the keyword search tool below to find specific information within the annual report.-
 1
1 -
2
-
3
-
4
-
5
-
6
-
7
-
8
-
9
-
10
-
11
-
12
-
13
-
14
-
15
-
16
-
17
-
18
-
19
-
20
-
21
-
22
-
23
-
24
-
25
-
26
-
27
-
28
-
29
-
30
-
31
-
32
-
33
-
34
-
35
-
36
-
37
-
38
-
39
-
40
-
41
-
42
-
43
-
44
-
45
-
46
-
47
-
48
-
49
-
50
-
51
-
52
-
 53
53 -
 54
54 -
 55
55 -
 56
56 -
 57
57 -
 58
58 -
 59
59 -
 60
60 -
 61
61 -
 62
62 -
 63
63 -
 64
64 -
 65
65 -
 66
66 -
 67
67 -
 68
68 -
 69
69 -
 70
70 -
 71
71 -
 72
72 -
 73
73 -
74
-
75
-
76
-
77
-
78
-
79
-
80
-
81
-
82
-
83
-
84
-
85
-
86
-
87
-
88
-
89
-
90
 |
 |

NOTES to CONSOLIDATED FINANCIAL STATEMENTS
Xcel Energy Annual Report 2004
61
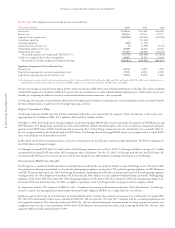
11. COMMON STOCK AND INCENTIVE STOCK PLANS
Common Stock and Equivalents Xcel Energy has common stock equivalents consisting of convertible senior notes, restricted stock units and stock
options, as discussed further.
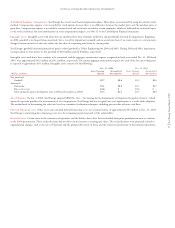
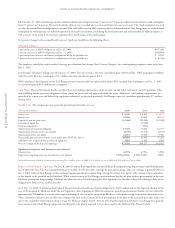
The dilutive impacts of common stock equivalents affected earnings per share as follows for the years ending Dec. 31:
2004 2003 2002
(Shares and dollars in thousands, Per Share Per Share Per Share
except per share amounts) Income Shares Amount Income Shares Amount Income Shares Amount
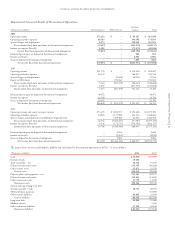
Income from continuing operations $526,929 $525,840 $551,388
Less: Dividend requirements on
preferred stock (4,241) (4,241) (4,241)
Basic earnings per share
Income from continuing operations 522,688 399,456 $1.31 521,599 398,765 $1.31 547,147 382,051 $1.43
Effect of dilutive securities:
$230 million convertible debt 11,940 18,654 11,213 18,654 1,246 2,027
$100 million convertible debt –– – – – 445
$57.5 million convertible debt 2,985 4,663 311 507 – –
Convertible debt option –– – 508 – –
Restricted stock units – 544 – 464 – –
Options –17 – 14 – 123
Diluted earnings per share
Income from continuing operations and
assumed conversions $537,613 423,334 $1.27 $533,123 418,912 $1.27 $548,393 384,646 $1.43
Incentive Stock Plans Xcel Energy and some of its subsidiaries have incentive compensation plans under which stock options and other performance
incentives are awarded to key employees. The weighted average number of common and potentially dilutive shares outstanding used to calculate Xcel Energy’s
earnings per share include the dilutive effect of stock options and other stock awards based on the treasury stock method. The options normally have a
term of 10 years and generally become exercisable from three to five years after grant date or upon specified circumstances. The tables below include
awards made by Xcel Energy and some of its predecessor companies, adjusted for the merger stock exchange ratio, and are presented on an Xcel Energy
share basis.
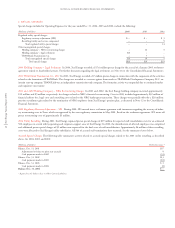
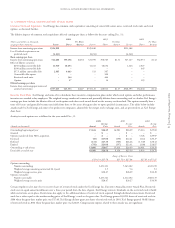
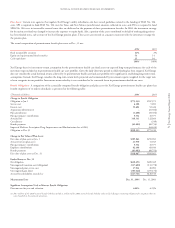
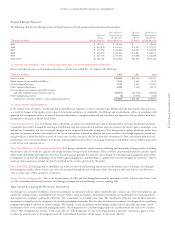
Activity in stock options was as follows for the years ended Dec. 31:
2004 2003 2002
Average Average Average
(Awards in thousands) Awards Price Awards Price Awards Price
Outstanding beginning of year 15,614 $26.49 16,981 $26.29 15,214 $25.65
Granted –$––$––$–
Options transferred from NRG acquisition –$– – $ – 3,328 $29.97
Exercised (45) $15.08 (190) $12.21 (112) $20.27
Forfeited (172) $25.10 (580) $28.48 (1,349) $28.43
Expired (791) $24.08 (597) $23.41 (100) $28.87
Outstanding at end of year 14,606 $26.67 15,614 $26.49 16,981 $26.29
Exercisable at end of year 10,096 $26.58 9,358 $25.59 8,933 $24.78
Range of Exercise Prices
$13.81 to $25.50 $25.51 to $27.00 $27.01 to $51.25
Options outstanding:
Number outstanding 3,223,321 7,263,102 4,120,235
Weighted average remaining contractual life (years) 3.5 5.4 5.3
Weighted average exercise price $20.47 $26.29 $32.20
Options exercisable:
Number exercisable 3,223,321 4,212,102 2,660,135
Weighted average exercise price $20.47 $26.27 $34.50
Certain employees also may elect to receive shares of restricted stock under the Xcel Energy Inc. Executive Annual Incentive Award Plan. Restricted
stock vests in equal annual installments over a three-year period from the date of grant. Xcel Energy reinvests dividends on the restricted stock it holds
while restrictions are in place. Restrictions also apply to the additional shares of restricted stock acquired through dividend reinvestment. Restricted
stock has a value equal to the market-trading price of Xcel Energy's stock at the grant date. Xcel Energy granted 65,090 shares of restricted stock in
2004 when the grant-date market price was $17.40. Xcel Energy did not grant any shares of restricted stock in 2003. Xcel Energy granted 50,083 shares
of restricted stock in 2002 when the grant-date market price was $22.83. Compensation expense related to these awards was not significant.