Xcel Energy 2004 Annual Report Download - page 44
Download and view the complete annual report
Please find page 44 of the 2004 Xcel Energy annual report below. You can navigate through the pages in the report by either clicking on the pages listed below, or by using the keyword search tool below to find specific information within the annual report.-
 1
1 -
2
-
3
-
4
-
5
-
6
-
7
-
8
-
9
-
10
-
11
-
12
-
13
-
14
-
15
-
16
-
17
-
18
-
19
-
20
-
21
-
22
-
23
-
24
-
25
-
26
-
27
-
28
-
29
-
30
-
31
-
32
-
33
-
 34
34 -
 35
35 -
 36
36 -
 37
37 -
 38
38 -
 39
39 -
 40
40 -
 41
41 -
 42
42 -
 43
43 -
 44
44 -
 45
45 -
 46
46 -
 47
47 -
 48
48 -
 49
49 -
 50
50 -
 51
51 -
 52
52 -
 53
53 -
 54
54 -
55
-
56
-
57
-
58
-
59
-
60
-
61
-
62
-
63
-
64
-
65
-
66
-
67
-
68
-
69
-
70
-
71
-
72
-
73
-
74
-
75
-
76
-
77
-
78
-
79
-
80
-
81
-
82
-
83
-
84
-
85
-
86
-
87
-
88
-
89
-
90
 |
 |

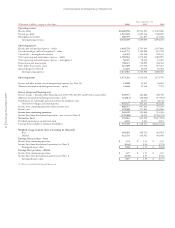
CONSOLIDATED STATEMENTS of OPERATIONS
Xcel Energy Annual Report 2004
42
Year ended Dec. 31
(Thousands of dollars, except per share data) 2004 2003 2002
Operating revenues
Electric utility $6,260,938 $5,951,852 $ 5,422,498
Natural gas utility 1,923,526 1,685,346 1,340,699
Nonregulated and other 160,795 221,807 211,048
Total operating revenues 8,345,259 7,859,005 6,974,245
Operating expenses
Electric fuel and purchased power – utility 3,040,759 2,705,839 2,197,801
Cost of natural gas sold and transported – utility 1,445,773 1,190,996 837,702
Cost of sales – nonregulated and other 83,394 142,540 109,535
Other operating and maintenance expenses – utility 1,592,564 1,570,492 1,480,955
Other operating and maintenance expenses – nonregulated 56,425 70,216 91,421
Depreciation and amortization 708,474 728,992 746,561
Taxes (other than income taxes) 327,029 317,878 317,247
Special charges (see Note 2) 17,625 19,039 19,265
Total operating expenses 7,272,043 6,745,992 5,800,487
Operating income 1,073,216 1,113,013 1,173,758
Interest and other income, net of nonoperating expenses (see Note 13) 14,808 10,101 36,803
Allowance for funds used during construction – equity 33,648 25,338 7,793
Interest charges and financing costs
Interest charges – (includes other financing costs of $27,296, $32,087 and $34,834, respectively) 458,971 448,882 400,709
Allowance for funds used during construction – debt (23,814) (20,402) (17,933)
Distributions on redeemable preferred securities of subsidiary trusts –22,731 38,344
Total interest charges and financing costs 435,157 451,211 421,120
Income from continuing operations before income taxes 686,515 697,241 797,234
Income taxes 159,586 171,401 245,846
Income from continuing operations 526,929 525,840 551,388
Income (loss) from discontinued operations – net of tax (see Note 3) (170,968) 96,552 (2,769,379)
Net income (loss) 355,961 622,392 (2,217,991)
Dividend requirements on preferred stock 4,241 4,241 4,241
Earnings (loss) available to common shareholders $ 351,720 $ 618,151 $(2,222,232)
Weighted average common shares outstanding (in thousands)
Basic 399,456 398,765 382,051
Diluted 423,334 418,912 384,646
Earnings (loss) per share – basic
Income from continuing operations $ 1.31 $ 1.31 $ 1.43
Income (loss) from discontinued operations (see Note 3) (0.43) 0.24 (7.25)
Earnings (loss) per share $ 0.88 $ 1.55 $ (5.82)
Earnings (loss) per share – diluted
Income from continuing operations $ 1.27 $ 1.27 $ 1.43
Income (loss) from discontinued operations (see Note 3) (0.40) 0.23 (7.20)
Earnings (loss) per share $ 0.87 $ 1.50 $ (5.77)
See Notes to Consolidated Financial Statements.