Western Union 2010 Annual Report Download - page 89
Download and view the complete annual report
Please find page 89 of the 2010 Western Union annual report below. You can navigate through the pages in the report by either clicking on the pages listed below, or by using the keyword search tool below to find specific information within the annual report.-
 1
1 -
2
-
3
-
4
-
5
-
6
-
7
-
8
-
9
-
10
-
11
-
12
-
13
-
14
-
15
-
16
-
17
-
18
-
19
-
20
-
21
-
22
-
23
-
24
-
25
-
26
-
27
-
28
-
29
-
30
-
31
-
32
-
33
-
34
-
35
-
36
-
37
-
38
-
39
-
40
-
41
-
42
-
43
-
44
-
45
-
46
-
47
-
48
-
49
-
50
-
51
-
52
-
53
-
54
-
55
-
56
-
57
-
58
-
59
-
60
-
61
-
62
-
63
-
64
-
65
-
66
-
67
-
68
-
69
-
70
-
71
-
72
-
73
-
74
-
75
-
76
-
77
-
78
-
 79
79 -
 80
80 -
 81
81 -
 82
82 -
 83
83 -
 84
84 -
 85
85 -
 86
86 -
 87
87 -
 88
88 -
 89
89 -
 90
90 -
 91
91 -
 92
92 -
 93
93 -
 94
94 -
 95
95 -
 96
96 -
 97
97 -
 98
98 -
 99
99 -
100
-
101
-
102
-
103
-
104
-
105
-
106
-
107
-
108
-
109
-
110
-
111
-
112
-
113
-
114
-
115
-
116
-
117
-
118
-
119
-
120
-
121
-
122
-
123
-
124
-
125
-
126
-
127
-
128
-
129
-
130
-
131
-
132
-
133
-
134
-
135
-
136
-
137
-
138
-
139
-
140
-
141
-
142
-
143
-
144
 |
 |

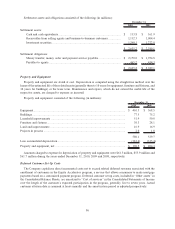
Goodwill
Goodwill represents the excess of purchase price over the fair value of tangible and other intangible assets
acquired, less liabilities assumed arising from business combinations. The Company’s annual goodwill impairment
test did not identify any goodwill impairment during the years ended December 31, 2010, 2009 and 2008.
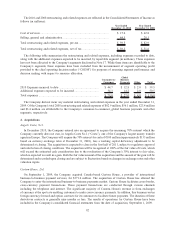
Other Intangible Assets
Other intangible assets primarily consist of contract costs (primarily amounts paid to agents in connection with
establishing and renewing long-term contracts), acquired contracts and software. Other intangible assets are
amortized on a straight-line basis over the length of the contract or benefit periods. Included in the Consolidated
Statements of Income is amortization expense of approximately $114.4 million, $98.3 million and $82.3 million for
the years ended December 31, 2010, 2009 and 2008, respectively.
The Company capitalizes initial payments for new and renewed agent contracts to the extent recoverable through
future operations or penalties in the case of early termination. The Company’s accounting policy is to limit the
amount of capitalized costs for a given contract to the lesser of the estimated future cash flows from the contract or
the termination fees the Company would receive in the event of early termination of the contract.
Acquired contracts include customer and contractual relationships and networks of subagents that are recognized
in connection with the Company’s acquisitions.
The Company develops software that is used in providing services. Software development costs are capitalized
once technological feasibility of the software has been established. Costs incurred prior to establishing
technological feasibility are expensed as incurred. Technological feasibility is established when the Company
has completed all planning and designing activities that are necessary to determine that a product can be produced to
meet its design specifications, including functions, features and technical performance requirements. Capitalization
of costs ceases when the product is available for general use. Software development costs and purchased software
are generally amortized over a term of three to five years.
The following table provides the components of other intangible assets (in millions):
Weighted-
Average
Amortization
Period
(in years)
Initial
Cost
Net of
Accumulated
Amortization
Initial
Cost
Net of
Accumulated
Amortization
December 31, 2010 December 31, 2009
Capitalized contract costs ........................ 6.7 $ 350.3 $ 164.6 $ 331.0 $ 189.7
Acquired contracts .................................. 10.7 256.5 186.8 250.0 205.5
Purchased or acquired software................ 3.7 113.9 30.7 102.7 35.5
Developed software................................. 4.3 86.1 13.7 78.1 11.0
Acquired trademarks ............................... 24.5 42.3 33.4 42.7 35.6
Projects in process .................................. 3.0 6.1 6.1 6.0 6.0
Other intangibles .................................... 4.1 24.0 2.7 34.1 5.9
Total other intangible assets..................... 8.0 $ 879.2 $ 438.0 $ 844.6 $ 489.2
The estimated future aggregate amortization expense for existing other intangible assets as of December 31,
2010 is expected to be $103.8 million in 2011, $77.9 million in 2012, $58.0 million in 2013, $43.3 million in 2014,
$33.5 million in 2015 and $121.5 million thereafter.
Other intangible assets are reviewed for impairment on an annual basis and whenever events indicate that their
carrying amount may not be recoverable. In such reviews, estimated undiscounted cash flows associated with these
assets or operations are compared with their carrying values to determine if a write-down to fair value (normally
measured by the present value technique) is required. The Company recorded other intangible asset impairments of
approximately $9 million for the year ended December 31, 2010 and did not record any impairment related to other
intangible assets during the years ended December 31, 2009 and 2008.
87