Western Union 2010 Annual Report Download - page 122
Download and view the complete annual report
Please find page 122 of the 2010 Western Union annual report below. You can navigate through the pages in the report by either clicking on the pages listed below, or by using the keyword search tool below to find specific information within the annual report.-
 1
1 -
2
-
3
-
4
-
5
-
6
-
7
-
8
-
9
-
10
-
11
-
12
-
13
-
14
-
15
-
16
-
17
-
18
-
19
-
20
-
21
-
22
-
23
-
24
-
25
-
26
-
27
-
28
-
29
-
30
-
31
-
32
-
33
-
34
-
35
-
36
-
37
-
38
-
39
-
40
-
41
-
42
-
43
-
44
-
45
-
46
-
47
-
48
-
49
-
50
-
51
-
52
-
53
-
54
-
55
-
56
-
57
-
58
-
59
-
60
-
61
-
62
-
63
-
64
-
65
-
66
-
67
-
68
-
69
-
70
-
71
-
72
-
73
-
74
-
75
-
76
-
77
-
78
-
79
-
80
-
81
-
82
-
83
-
84
-
85
-
86
-
87
-
88
-
89
-
90
-
91
-
92
-
93
-
94
-
95
-
96
-
97
-
98
-
99
-
100
-
101
-
102
-
103
-
104
-
105
-
106
-
107
-
108
-
109
-
110
-
111
-
 112
112 -
 113
113 -
 114
114 -
 115
115 -
 116
116 -
 117
117 -
 118
118 -
 119
119 -
 120
120 -
 121
121 -
 122
122 -
 123
123 -
 124
124 -
 125
125 -
 126
126 -
 127
127 -
 128
128 -
 129
129 -
 130
130 -
 131
131 -
 132
132 -
133
-
134
-
135
-
136
-
137
-
138
-
139
-
140
-
141
-
142
-
143
-
144
 |
 |

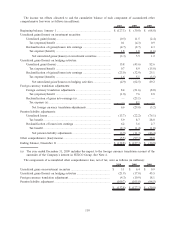
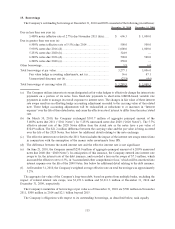
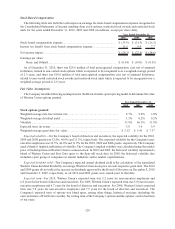
Stock-Based Compensation
The following table sets forth the total impact on earnings for stock-based compensation expense recognized in
the Consolidated Statements of Income resulting from stock options, restricted stock awards and restricted stock
units for the years ended December 31, 2010, 2009 and 2008 (in millions, except per share data).
2010 2009 2008
Year Ended December 31,
Stock-based compensation expense ................................................................ $ (35.9) $ (31.9) $ (26.3)
Income tax benefit from stock-based compensation expense............................ 11.6 9.9 7.7
Net income impact ....................................................................................... $ (24.3) $ (22.0) $ (18.6)
Earnings per share:
Basic and Diluted.................................................................................. $ (0.04) $ (0.03) $ (0.03)
As of December 31, 2010, there was $24.6 million of total unrecognized compensation cost, net of assumed
forfeitures, related to non-vested stock options which is expected to be recognized over a weighted-average period
of 2.5 years, and there was $18.0 million of total unrecognized compensation cost, net of assumed forfeitures,
related to non-vested restricted stock awards and restricted stock units which is expected to be recognized over a
weighted-average period of 2.0 years.
Fair Value Assumptions
The Company used the following assumptions for the Black-Scholes option pricing model to determine the value
of Western Union options granted.
2010 2009 2008
Year Ended December 31,
Stock options granted:
Weighted-average risk-free interest rate ............................................................. 2.7% 2.0% 3.0%
Weighted-average dividend yield ....................................................................... 1.3% 0.2% 0.2%
Volatility ......................................................................................................... 33.9% 46.3% 31.8%
Expected term (in years)................................................................................... 5.8 5.6 5.9
Weighted-average grant date fair value .............................................................. $ 5.12 $ 5.41 $ 7.57
Expected volatility—For the Company’s board of directors and executives, the expected volatility for the 2010,
2009 and 2008 grants was 32.8%, 46.9% and 31.3%, respectively. The expected volatility for the Company’s non-
executive employees was 34.5%, 46.0% and 31.9% for the 2010, 2009 and 2008 grants, respectively. The Company
used a blend of implied and historical volatility. The Company’s implied volatility was calculated using the market
price of traded options on Western Union’s common stock. In 2010 and 2009, the historical volatility represented a
blend of Western Union and First Data (prior to the Spin-off) stock data. In 2008, the historical volatility also
included a peer group of companies in similar industries and/or market capitalizations.
Expected dividend yield—The Company’s expected annual dividend yield is the calculation of the annualized
Western Union dividend divided by an average Western Union stock price on each respective grant date. The 2010
and 2009 grants do not reflect the increase in dividends approved by the Board of Directors on December 8, 2010
and December 9, 2009, respectively, as all 2010 and 2009 grants were issued prior to that date.
Expected term—For 2010, Western Union’s expected term was 5.2 years for non-executive employees and
6.8 years for the board of directors and executives. For 2009, Western Union’s expected term was 5.0 years for non-
executive employees and 6.7 years for the board of directors and executives. For 2008, Western Union’s expected
term was 5.8 years for non-executive employees and 7.5 years for the board of directors and executives. The
Company’s expected term of options was based upon, among other things, historical exercises (including the
exercise history of First Data’s awards), the vesting term of the Company’s options and the options’ contractual term
of ten years.
120