Western Union 2010 Annual Report Download - page 56
Download and view the complete annual report
Please find page 56 of the 2010 Western Union annual report below. You can navigate through the pages in the report by either clicking on the pages listed below, or by using the keyword search tool below to find specific information within the annual report.-
 1
1 -
2
-
3
-
4
-
5
-
6
-
7
-
8
-
9
-
10
-
11
-
12
-
13
-
14
-
15
-
16
-
17
-
18
-
19
-
20
-
21
-
22
-
23
-
24
-
25
-
26
-
27
-
28
-
29
-
30
-
31
-
32
-
33
-
34
-
35
-
36
-
37
-
38
-
39
-
40
-
41
-
42
-
43
-
44
-
45
-
 46
46 -
 47
47 -
 48
48 -
 49
49 -
 50
50 -
 51
51 -
 52
52 -
 53
53 -
 54
54 -
 55
55 -
 56
56 -
 57
57 -
 58
58 -
 59
59 -
 60
60 -
 61
61 -
 62
62 -
 63
63 -
 64
64 -
 65
65 -
 66
66 -
67
-
68
-
69
-
70
-
71
-
72
-
73
-
74
-
75
-
76
-
77
-
78
-
79
-
80
-
81
-
82
-
83
-
84
-
85
-
86
-
87
-
88
-
89
-
90
-
91
-
92
-
93
-
94
-
95
-
96
-
97
-
98
-
99
-
100
-
101
-
102
-
103
-
104
-
105
-
106
-
107
-
108
-
109
-
110
-
111
-
112
-
113
-
114
-
115
-
116
-
117
-
118
-
119
-
120
-
121
-
122
-
123
-
124
-
125
-
126
-
127
-
128
-
129
-
130
-
131
-
132
-
133
-
134
-
135
-
136
-
137
-
138
-
139
-
140
-
141
-
142
-
143
-
144
 |
 |

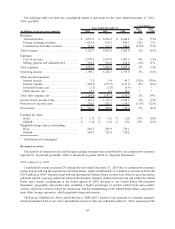
United States and competitive pressures, which resulted in lower cash and electronic volumes and a shift to lower
revenue per transaction products, also contributed to the revenue declines.
The transaction declines during the year ended December 31, 2010 compared to the same period in 2009 were
due to declines in our United States bill payments businesses.
2009 compared to 2008
During the year ended December 31, 2009, the global business payments segment revenue was adversely
impacted by the weak economic situation in the United States, which resulted in a revenue decline in our United
States cash and electronic bill payments businesses, partially offset by $30.8 million in revenue generated from our
September 1, 2009 acquisition of Custom House and slight growth in the Pago Fácil business. The segment’s
revenues were primarily generated in the United States for the year ended December 31, 2009.
Transaction growth during the year ended December 31, 2009 compared to 2008 was driven by our Pago Fácil
cash-based and United States electronic-based bill payments businesses. Both of these businesses carry a lower
revenue per transaction than our United States cash-based bill payment business. The transaction growth was offset
by a decline in the United States cash-based bill payments business.
Operating income
2010 compared to 2009
For the year ended December 31, 2010, operating income decreased compared to the same period in the prior
year primarily due to declines related to the United States-based bill payments business, and investing and operating
costs, including amortization expense, associated with the acquisition of Custom House.
The decline in operating income margin in the segment is primarily due to the increased costs associated with the
acquisition of Custom House and declines in our United States bill payments businesses.
2009 compared to 2008
For the year ended December 31, 2009, operating income decreased compared to the same period in the prior
year primarily due to operating income declines related to the United States-based bill payments business and
operating and integration costs associated with the acquisition of Custom House, offset slightly by the savings
generated from the 2008 restructurings.
The decline in operating income margin in the segment is due to the factors described above and continues to be
impacted by the decline in the United States cash-based bill payments business which has a higher operating income
margin than our South America and electronic businesses.
Other
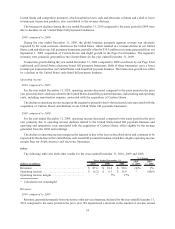
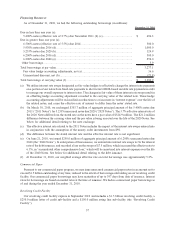
The following table sets forth other results for the years ended December 31, 2010, 2009 and 2008.
(dollars in millions) 2010 2009 2008
2010
vs. 2009
2009
vs. 2008
Years Ended December 31,
% Change
Revenues ............................................................... $ 87.6 $ 91.2 $ 90.6 (4)% 1%
Operating income ................................................... $ (6.2) $ 6.3 $ 15.8 * (60)%
Operating income margin........................................ * 7% 17%
* Calculation not meaningful
Revenues
2010 compared to 2009
Revenue, generated primarily from our money order services business, declined for the year ended December 31,
2010 compared to the same period in the prior year. We experienced a decrease in the amount of revenue earned
54