Western Union 2010 Annual Report Download - page 74
Download and view the complete annual report
Please find page 74 of the 2010 Western Union annual report below. You can navigate through the pages in the report by either clicking on the pages listed below, or by using the keyword search tool below to find specific information within the annual report.-
 1
1 -
2
-
3
-
4
-
5
-
6
-
7
-
8
-
9
-
10
-
11
-
12
-
13
-
14
-
15
-
16
-
17
-
18
-
19
-
20
-
21
-
22
-
23
-
24
-
25
-
26
-
27
-
28
-
29
-
30
-
31
-
32
-
33
-
34
-
35
-
36
-
37
-
38
-
39
-
40
-
41
-
42
-
43
-
44
-
45
-
46
-
47
-
48
-
49
-
50
-
51
-
52
-
53
-
54
-
55
-
56
-
57
-
58
-
59
-
60
-
61
-
62
-
63
-
 64
64 -
 65
65 -
 66
66 -
 67
67 -
 68
68 -
 69
69 -
 70
70 -
 71
71 -
 72
72 -
 73
73 -
 74
74 -
 75
75 -
 76
76 -
 77
77 -
 78
78 -
 79
79 -
 80
80 -
 81
81 -
 82
82 -
 83
83 -
 84
84 -
85
-
86
-
87
-
88
-
89
-
90
-
91
-
92
-
93
-
94
-
95
-
96
-
97
-
98
-
99
-
100
-
101
-
102
-
103
-
104
-
105
-
106
-
107
-
108
-
109
-
110
-
111
-
112
-
113
-
114
-
115
-
116
-
117
-
118
-
119
-
120
-
121
-
122
-
123
-
124
-
125
-
126
-
127
-
128
-
129
-
130
-
131
-
132
-
133
-
134
-
135
-
136
-
137
-
138
-
139
-
140
-
141
-
142
-
143
-
144
 |
 |
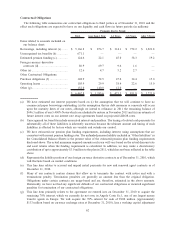
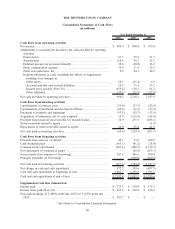
and are included in our consolidated balance sheets within “cash and cash equivalents” and “settlement assets.” To
the extent these assets are held in connection with money transfers and other related payment services awaiting
redemption, they are classified as “settlement assets.” Earnings on these investments will increase and decrease with
changes in the underlying short-term interest rates.
Substantially all of the remainder of our interest bearing assets consist of fixed rate instruments, the substantial
majority of which are highly rated state and municipal debt securities. These investments may include investments
made from cash received from our money transfer business and other related payment services awaiting redemption
classified within “settlement assets” in the consolidated balance sheets. As interest rates rise, the fair value of these
fixed rate interest-bearing securities will decrease; conversely, a decrease to interest rates would result in an increase
to the fair values of the securities. We have classified these investments as available-for-sale within “settlement
assets” in the consolidated balance sheets, and accordingly, recorded these instruments at their fair value with the
net unrealized gains and losses, net of the applicable deferred income tax effect, being added to or deducted from
our “total stockholders’ equity” on our consolidated balance sheets.
As of December 31, 2010, $1.2 billion of our total $3.3 billion in borrowings was effectively floating rate debt
through interest rate swap agreements, changing our fixed-rate debt to LIBOR-based floating rate debt, with
average spreads of approximately 500 basis points above LIBOR. Borrowings under our commercial paper program
mature in such a short period that the financing is effectively floating rate. No commercial paper borrowings were
outstanding as of and for the year ended December 31, 2010.
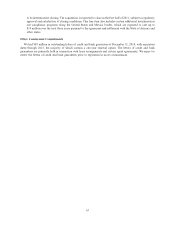
We review our overall exposure to floating and fixed rates by evaluating our net asset or liability position in each,
also considering the duration of the individual positions. We manage this mix of fixed versus floating exposure in an
attempt to minimize risk, reduce costs, and optimize returns. Our exposure to interest rates can be modified by
changing the mix of our interest bearing assets, as well as adjusting the mix of fixed versus floating rate debt. The
latter is accomplished primarily through the use of interest rate swaps and the decision regarding terms of any new
debt issuances (i.e., fixed versus floating). We use interest rate swaps designated as hedges to increase the
percentage of floating rate debt, subject to market conditions. At December 31, 2010, our weighted-average interest
rate on our borrowings outstanding, including our hedges, was approximately 5.2%.
A hypothetical 100 basis point increase/decrease in interest rates would result in a decrease/increase to pre-tax
income of approximately $12 million and $8 million annually based on borrowings on December 31, 2010 and
2009, respectively, that are sensitive to interest rate fluctuations. The same 100 basis point increase/decrease in
interest rates, if applied to our cash and investment balances on December 31, 2010 and 2009 that are sensitive to
interest rate fluctuations, would result in an offsetting benefit/reduction to pre-tax income of approximately
$25 million and $20 million annually, respectively. There are inherent limitations in the sensitivity analysis
presented, primarily due to the assumption that interest rate changes would be instantaneous. As a result, the
analysis is unable to reflect the potential effects of more complex market changes that could arise, including
changes in credit risk regarding our investments, which may positively or negatively affect income. In addition, the
current mix of fixed versus floating rate debt and investments and the level of assets and liabilities will change over
time.
Credit Risk
Our interest earning assets include investment securities, substantially all of which are state and municipal debt
securities, which are classified in “settlement assets” and accounted for as available-for-sale securities, and money
market fund investments, which are classified in “cash and cash equivalents.” The majority of our investment
securities had credit ratings of “AA-” or better from a major credit rating agency.
To manage our exposures to credit risk with respect to investment securities, money market investments,
derivatives and other credit risk exposures resulting from our relationships with banks and financial institutions, we
regularly review investment concentrations, trading levels, credit spreads and credit ratings, and we attempt to
diversify our investments among global financial institutions. Since January 1, 2009, we also limit our investment
level to no more than $100 million with respect to individual money market funds.
72