Western Union 2010 Annual Report Download - page 102
Download and view the complete annual report
Please find page 102 of the 2010 Western Union annual report below. You can navigate through the pages in the report by either clicking on the pages listed below, or by using the keyword search tool below to find specific information within the annual report.-
 1
1 -
2
-
3
-
4
-
5
-
6
-
7
-
8
-
9
-
10
-
11
-
12
-
13
-
14
-
15
-
16
-
17
-
18
-
19
-
20
-
21
-
22
-
23
-
24
-
25
-
26
-
27
-
28
-
29
-
30
-
31
-
32
-
33
-
34
-
35
-
36
-
37
-
38
-
39
-
40
-
41
-
42
-
43
-
44
-
45
-
46
-
47
-
48
-
49
-
50
-
51
-
52
-
53
-
54
-
55
-
56
-
57
-
58
-
59
-
60
-
61
-
62
-
63
-
64
-
65
-
66
-
67
-
68
-
69
-
70
-
71
-
72
-
73
-
74
-
75
-
76
-
77
-
78
-
79
-
80
-
81
-
82
-
83
-
84
-
85
-
86
-
87
-
88
-
89
-
90
-
91
-
 92
92 -
 93
93 -
 94
94 -
 95
95 -
 96
96 -
 97
97 -
 98
98 -
 99
99 -
 100
100 -
 101
101 -
 102
102 -
 103
103 -
 104
104 -
 105
105 -
 106
106 -
 107
107 -
 108
108 -
 109
109 -
 110
110 -
 111
111 -
 112
112 -
113
-
114
-
115
-
116
-
117
-
118
-
119
-
120
-
121
-
122
-
123
-
124
-
125
-
126
-
127
-
128
-
129
-
130
-
131
-
132
-
133
-
134
-
135
-
136
-
137
-
138
-
139
-
140
-
141
-
142
-
143
-
144
 |
 |

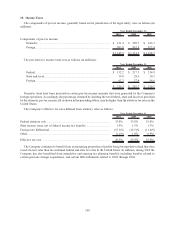
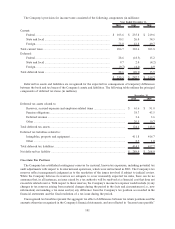
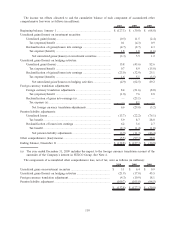
10. Income Taxes
The components of pre-tax income, generally based on the jurisdiction of the legal entity, were as follows (in
millions):
2010 2009 2008
Year Ended December 31,
Components of pre-tax income:
Domestic ....................................................................................... $ 151.4 $ 249.7 $ 416.3
Foreign .......................................................................................... 993.8 881.8 822.4
$ 1,145.2 $ 1,131.5 $ 1,238.7
The provision for income taxes was as follows (in millions):
2010 2009 2008
Year Ended December 31,
Federal .......................................................................................... $ 132.2 $ 217.3 $ 234.8
State and local ............................................................................... 39.8 28.0 30.3
Foreign.......................................................................................... 63.3 37.4 54.6
$ 235.3 $ 282.7 $ 319.7
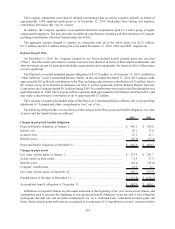
Domestic taxes have been incurred on certain pre-tax income amounts that were generated by the Company’s
foreign operations. Accordingly, the percentage obtained by dividing the total federal, state and local tax provision
by the domestic pre-tax income, all as shown in the preceding tables, may be higher than the statutory tax rates in the
United States.
The Company’s effective tax rates differed from statutory rates as follows:
2010 2009 2008
Year Ended December 31,
Federal statutory rate ............................................................................. 35.0% 35.0% 35.0%
State income taxes, net of federal income tax benefits ............................. 1.9% 1.5% 1.3%
Foreign rate differential ......................................................................... (15.3)% (12.5)% (11.4)%
Other.................................................................................................... (1.1)% 1.0% 0.9%
Effective tax rate ................................................................................... 20.5% 25.0% 25.8%
The Company continues to benefit from an increasing proportion of profits being foreign-derived and therefore
taxed at lower rates than its combined federal and state tax rates in the United States. In addition, during 2010 the
Company has also benefitted from cumulative and ongoing tax planning benefits, including benefits related to
certain previous foreign acquisitions, and certain IRS settlements related to 2002 through 2004.
100