Western Union 2010 Annual Report Download - page 43
Download and view the complete annual report
Please find page 43 of the 2010 Western Union annual report below. You can navigate through the pages in the report by either clicking on the pages listed below, or by using the keyword search tool below to find specific information within the annual report.-
 1
1 -
2
-
3
-
4
-
5
-
6
-
7
-
8
-
9
-
10
-
11
-
12
-
13
-
14
-
15
-
16
-
17
-
18
-
19
-
20
-
21
-
22
-
23
-
24
-
25
-
26
-
27
-
28
-
29
-
30
-
31
-
32
-
 33
33 -
 34
34 -
 35
35 -
 36
36 -
 37
37 -
 38
38 -
 39
39 -
 40
40 -
 41
41 -
 42
42 -
 43
43 -
 44
44 -
 45
45 -
 46
46 -
 47
47 -
 48
48 -
 49
49 -
 50
50 -
 51
51 -
 52
52 -
 53
53 -
54
-
55
-
56
-
57
-
58
-
59
-
60
-
61
-
62
-
63
-
64
-
65
-
66
-
67
-
68
-
69
-
70
-
71
-
72
-
73
-
74
-
75
-
76
-
77
-
78
-
79
-
80
-
81
-
82
-
83
-
84
-
85
-
86
-
87
-
88
-
89
-
90
-
91
-
92
-
93
-
94
-
95
-
96
-
97
-
98
-
99
-
100
-
101
-
102
-
103
-
104
-
105
-
106
-
107
-
108
-
109
-
110
-
111
-
112
-
113
-
114
-
115
-
116
-
117
-
118
-
119
-
120
-
121
-
122
-
123
-
124
-
125
-
126
-
127
-
128
-
129
-
130
-
131
-
132
-
133
-
134
-
135
-
136
-
137
-
138
-
139
-
140
-
141
-
142
-
143
-
144
 |
 |
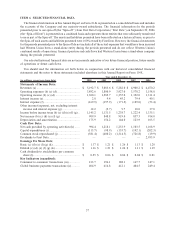
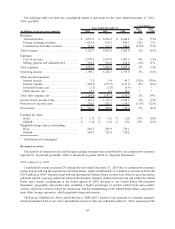
• We generated $1,300.1 million in consolidated operating income compared to $1,282.7 million in the prior
year, representing an increase of 1%. The current year results include the restructuring and related expenses
mentioned above. The prior year results included an accrual of $71.0 million resulting from an agreement and
settlement which includes the resolution of all outstanding legal issues and claims with the State of Arizona
and a multi-state agreement to fund a not-for-profit organization promoting safety and security along the
United States and Mexico border (the “settlement accrual”).
• Our operating income margin was 25% during the year ended December 31, 2010, which is flat
year-over-year. The current year results include the restructuring and related expenses mentioned above,
while the prior year results include the settlement accrual mentioned above.
• Consolidated net income was $909.9 million, representing an increase of 7% from 2009. The current year
results include $39.3 million in restructuring and related expenses, net of tax. The prior year results include
the settlement accrual of $53.9 million, net of tax.
• Our consumers transferred $76 billion in consumer-to-consumer principal, of which $69 billion related to
cross-border principal, which represented an increase of 6% in both consumer-to-consumer principal and
cross-border principal over the prior year.
• Consolidated cash flows provided by operating activities were $994.4 million, a decrease of 18% over 2009.
This decrease was primarily the result of a $250 million refundable tax deposit we made relating to potential
United States federal tax liabilities, including those arising from our 2003 international restructuring, which
have been previously accrued for in our financial statements.
• We issued $250 million of aggregate principal amount of our 6.200% notes due 2040 (“2040 Notes”) during
the year ended December 31, 2010.
• We exchanged $303.7 million of aggregate principal amount of our 5.400% notes due 2011 (“2011 Notes”)
for $324.9 million aggregate principal amount of 5.253% (effective rate of 5.7%) notes due 2020 (“2020
Notes”) during the year ended December 31, 2010.
Our strategic priorities for ensuring our long-term success include accelerating profitable growth in our retail
channels, expanding our electronic channels to offer more choice and gain new consumers, developing new
products and services for our consumers and improving our processes and productivity to help drive growth and
improve our profitability. Significant factors affecting our financial position and results of operations include:
• Transaction volume is the primary generator of revenue in our businesses. Transaction volume in our
consumer-to-consumer segment is affected by, among other things, the size of the international migrant
population and individual needs to transfer funds in emergency situations. As noted elsewhere in this Annual
Report on Form 10-K, a reduction in the size of the migrant population, interruptions in migration patterns or
reduced employment opportunities including those resulting from any changes in immigration laws,
economic development patterns or political events, could adversely affect our transaction volume. For
discussion on how these factors have impacted us in recent periods, refer to the consumer-to-consumer
segment discussion below.
• Revenue is also impacted by changes in the fees we charge consumers, the principal sent per transaction and
by the variance in the exchange rate set by us to the customer and the rate at which we or our agents are able to
acquire currency. We intend to continue to implement future strategic fee reductions and actions to reduce
foreign exchange spreads, where appropriate, taking into account growth opportunities and including
competitive factors. Decreases in our fees or foreign exchange spreads generally reduce margins, but are
done in anticipation that they will result in increased transaction volumes and increased revenues over time.
• A majority of our cost structure is comprised of agent commissions, which are generally variable and
fluctuate as revenues fluctuate.
• Fluctuations in the exchange rate between the United States dollar and other currencies impact our
transaction fee and foreign exchange revenue. The impact to earnings per share is less than the revenue
impact due to the translation of expenses and our foreign currency hedging program.
41