Western Union 2010 Annual Report Download - page 52
Download and view the complete annual report
Please find page 52 of the 2010 Western Union annual report below. You can navigate through the pages in the report by either clicking on the pages listed below, or by using the keyword search tool below to find specific information within the annual report.-
 1
1 -
2
-
3
-
4
-
5
-
6
-
7
-
8
-
9
-
10
-
11
-
12
-
13
-
14
-
15
-
16
-
17
-
18
-
19
-
20
-
21
-
22
-
23
-
24
-
25
-
26
-
27
-
28
-
29
-
30
-
31
-
32
-
33
-
34
-
35
-
36
-
37
-
38
-
39
-
40
-
41
-
 42
42 -
 43
43 -
 44
44 -
 45
45 -
 46
46 -
 47
47 -
 48
48 -
 49
49 -
 50
50 -
 51
51 -
 52
52 -
 53
53 -
 54
54 -
 55
55 -
 56
56 -
 57
57 -
 58
58 -
 59
59 -
 60
60 -
 61
61 -
 62
62 -
63
-
64
-
65
-
66
-
67
-
68
-
69
-
70
-
71
-
72
-
73
-
74
-
75
-
76
-
77
-
78
-
79
-
80
-
81
-
82
-
83
-
84
-
85
-
86
-
87
-
88
-
89
-
90
-
91
-
92
-
93
-
94
-
95
-
96
-
97
-
98
-
99
-
100
-
101
-
102
-
103
-
104
-
105
-
106
-
107
-
108
-
109
-
110
-
111
-
112
-
113
-
114
-
115
-
116
-
117
-
118
-
119
-
120
-
121
-
122
-
123
-
124
-
125
-
126
-
127
-
128
-
129
-
130
-
131
-
132
-
133
-
134
-
135
-
136
-
137
-
138
-
139
-
140
-
141
-
142
-
143
-
144
 |
 |

(a) The geographic split is determined based upon the region where the money transfer is initiated and the region
where the money transfer is paid. For transactions originated and paid in different regions, we split the revenue
between the two regions, with each region receiving 50%. For money transfers initiated and paid in the same
region, 100% of the revenue is attributed to that region.
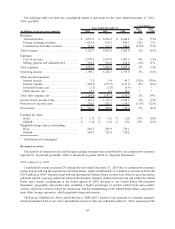
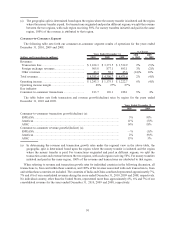
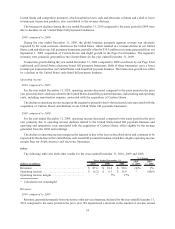
Consumer-to-Consumer Segment
The following table sets forth our consumer-to-consumer segment results of operations for the years ended
December 31, 2010, 2009 and 2008.
(dollars and transactions in millions) 2010 2009 2008
2010
vs. 2009
2009
vs. 2008
Years Ended December 31,
% Change
Revenues:
Transaction fees ................................................... $ 3,434.3 $ 3,373.5 $ 3,532.9 2% (5)%
Foreign exchange revenues .................................... 905.8 877.1 893.1 3% (2)%
Other revenues ..................................................... 43.3 50.1 45.6 (14)% 10%
Total revenues ........................................................ $ 4,383.4 $ 4,300.7 $ 4,471.6 2% (4)%
Operating income ................................................... $ 1,243.3 $ 1,175.5 $ 1,222.7 6% (4)%
Operating income margin........................................ 28% 27% 27%
Key indicator:
Consumer-to-consumer transactions ......................... 213.7 196.1 188.1 9% 4%
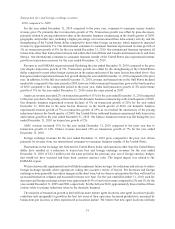
The table below sets forth transaction and revenue growth/(decline) rates by region for the years ended
December 31, 2010 and 2009.
2010 2009
Years Ended December 31,
Consumer-to-consumer transaction growth/(decline) (a):
EMEASA....................................................................................................... 5% 10%
Americas........................................................................................................ 11% (3)%
APAC ............................................................................................................ 14% 18%
Consumer-to-consumer revenue growth/(decline) (a):
EMEASA....................................................................................................... —% (1)%
Americas........................................................................................................ 2% (9)%
APAC ............................................................................................................ 13% 5%
(a) In determining the revenue and transaction growth rates under the regional view in the above table, the
geographic split is determined based upon the region where the money transfer is initiated and the region
where the money transfer is paid. For transactions originated and paid in different regions, we split the
transaction count and revenue between the two regions, with each region receiving 50%. For money transfers
initiated and paid in the same region, 100% of the revenue and transactions are attributed to that region.
When referring to revenue and transaction growth rates for individual countries in the following discussion, all
transactions to, from and within those countries, and 100% of the revenue associated with each transaction to, from
and within those countries are included. The countries of India and China combined represented approximately 7%,
7% and 6% of our consolidated revenues during the years ended December 31, 2010, 2009 and 2008, respectively.
No individual country, other than the United States, represented more than approximately 6%, 6% and 7% of our
consolidated revenue for the years ended December 31, 2010, 2009 and 2008, respectively.
50