Western Union 2010 Annual Report Download - page 55
Download and view the complete annual report
Please find page 55 of the 2010 Western Union annual report below. You can navigate through the pages in the report by either clicking on the pages listed below, or by using the keyword search tool below to find specific information within the annual report.-
 1
1 -
2
-
3
-
4
-
5
-
6
-
7
-
8
-
9
-
10
-
11
-
12
-
13
-
14
-
15
-
16
-
17
-
18
-
19
-
20
-
21
-
22
-
23
-
24
-
25
-
26
-
27
-
28
-
29
-
30
-
31
-
32
-
33
-
34
-
35
-
36
-
37
-
38
-
39
-
40
-
41
-
42
-
43
-
44
-
 45
45 -
 46
46 -
 47
47 -
 48
48 -
 49
49 -
 50
50 -
 51
51 -
 52
52 -
 53
53 -
 54
54 -
 55
55 -
 56
56 -
 57
57 -
 58
58 -
 59
59 -
 60
60 -
 61
61 -
 62
62 -
 63
63 -
 64
64 -
 65
65 -
66
-
67
-
68
-
69
-
70
-
71
-
72
-
73
-
74
-
75
-
76
-
77
-
78
-
79
-
80
-
81
-
82
-
83
-
84
-
85
-
86
-
87
-
88
-
89
-
90
-
91
-
92
-
93
-
94
-
95
-
96
-
97
-
98
-
99
-
100
-
101
-
102
-
103
-
104
-
105
-
106
-
107
-
108
-
109
-
110
-
111
-
112
-
113
-
114
-
115
-
116
-
117
-
118
-
119
-
120
-
121
-
122
-
123
-
124
-
125
-
126
-
127
-
128
-
129
-
130
-
131
-
132
-
133
-
134
-
135
-
136
-
137
-
138
-
139
-
140
-
141
-
142
-
143
-
144
 |
 |

Foreign exchange revenues decreased for the year ended December 31, 2009 over the corresponding previous
period at a rate relatively consistent with the decrease in our revenue from our international consumer-to-consumer
business outside of the United States.
Fluctuations in the exchange rate between the United States dollar and currencies other than the United States
dollar have resulted in a reduction to transaction fee and foreign exchange revenue for the year ended December 31,
2009 of $101.3 million over the same period in the previous year, net of foreign currency hedges, that would not
have occurred had there been constant currency rates.
Operating income
2010 compared to 2009
Consumer-to-consumer operating income increased 6% during the year ended December 31, 2010 compared to
the same period in 2009 due to lower marketing expenses and operating efficiencies, primarily decreased bad debt
expense, offset by higher employee compensation costs and incremental costs associated with our retail expansion
in Europe pursuant to the Payment Services Directive. The increase in operating income margin for the year ended
December 31, 2010 compared to the same period in the prior year resulted from these same factors.
2009 compared to 2008
Consumer-to-consumer operating income decreased 4% during the year ended December 31, 2009 compared to
2008 due to the decline in revenue, incremental costs, including increased technology costs and the acquisition of
FEXCO, offset somewhat by reduced agent commissions, savings realized from the 2008 restructurings and better
leveraging of our marketing expenses, as described earlier. The operating income margin for the year ended
December 31, 2009 was consistent with 2008.
Global Business Payments Segment
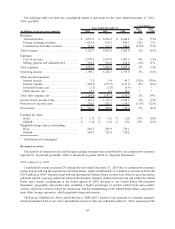
The following table sets forth our global business payments segment results of operations for the years ended
December 31, 2010, 2009 and 2008.
(dollars and transactions in millions) 2010 2009 2008
2010
vs. 2009
2009
vs. 2008
Years Ended December 31,
% Change
Revenues:
Transaction fees.................................................. $ 578.0 $ 621.9 $ 668.1 (7)% (7)%
Foreign exchange revenues .................................. 113.0 33.2 3.2 * *
Other revenues ................................................... 30.7 36.6 48.5 (16)% (25)%
Total revenues ........................................................ $ 721.7 $ 691.7 $ 719.8 4% (4)%
Operating income ................................................... $ 122.5 $ 171.9 $ 199.4 (29)% (14)%
Operating income margin........................................ 17% 25% 28%
Key indicator:
Global business payments transactions ..................... 404.9 414.8 412.1 (2)% 1%
* Calculation not meaningful
Revenues
2010 compared to 2009
During the year ended December 31, 2010, global business payments segment revenue was positively impacted
by our acquisition of Custom House, which contributed $111.0 million of revenue in 2010 versus $30.8 million in
2009, primarily included in foreign exchange revenues, and growth in the Pago Fácil business. These increases were
offset by revenue declines in our United States bill payments businesses as many United States consumers who
would use our services continue to have difficulty paying their bills and continue to be unable to obtain credit in any
form, resulting in us handling fewer bill payments. The ongoing trend away from cash based bill payments in the
53