Western Union 2010 Annual Report Download - page 115
Download and view the complete annual report
Please find page 115 of the 2010 Western Union annual report below. You can navigate through the pages in the report by either clicking on the pages listed below, or by using the keyword search tool below to find specific information within the annual report.-
 1
1 -
2
-
3
-
4
-
5
-
6
-
7
-
8
-
9
-
10
-
11
-
12
-
13
-
14
-
15
-
16
-
17
-
18
-
19
-
20
-
21
-
22
-
23
-
24
-
25
-
26
-
27
-
28
-
29
-
30
-
31
-
32
-
33
-
34
-
35
-
36
-
37
-
38
-
39
-
40
-
41
-
42
-
43
-
44
-
45
-
46
-
47
-
48
-
49
-
50
-
51
-
52
-
53
-
54
-
55
-
56
-
57
-
58
-
59
-
60
-
61
-
62
-
63
-
64
-
65
-
66
-
67
-
68
-
69
-
70
-
71
-
72
-
73
-
74
-
75
-
76
-
77
-
78
-
79
-
80
-
81
-
82
-
83
-
84
-
85
-
86
-
87
-
88
-
89
-
90
-
91
-
92
-
93
-
94
-
95
-
96
-
97
-
98
-
99
-
100
-
101
-
102
-
103
-
104
-
 105
105 -
 106
106 -
 107
107 -
 108
108 -
 109
109 -
 110
110 -
 111
111 -
 112
112 -
 113
113 -
 114
114 -
 115
115 -
 116
116 -
 117
117 -
 118
118 -
 119
119 -
 120
120 -
 121
121 -
 122
122 -
 123
123 -
 124
124 -
 125
125 -
126
-
127
-
128
-
129
-
130
-
131
-
132
-
133
-
134
-
135
-
136
-
137
-
138
-
139
-
140
-
141
-
142
-
143
-
144
 |
 |

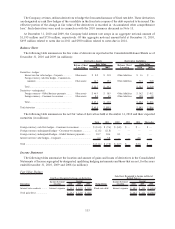
The Company, at times, utilizes derivatives to hedge the forecasted issuance of fixed rate debt. These derivatives
are designated as cash flow hedges of the variability in the fixed rate coupon of the debt expected to be issued. The
effective portion of the change in fair value of the derivatives is recorded in “Accumulated other comprehensive
loss.” Such derivatives were used in connection with the 2010 issuances discussed in Note 15.
At December 31, 2010 and 2009, the Company held interest rate swaps in an aggregate notional amount of
$1,195 million and $750 million, respectively. Of this aggregate notional amount held at December 31, 2010,
$695 million related to notes due in 2011 and $500 million related to notes due in 2014.
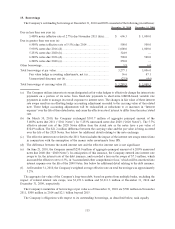
Balance Sheet
The following table summarizes the fair value of derivatives reported in the Consolidated Balance Sheets as of
December 31, 2010 and 2009 (in millions):
Balance Sheet
Location 2010 2009
Balance Sheet
Location 2010 2009
Fair Value Fair Value
Derivative Assets Derivative Liabilities
Derivatives—hedges:
Interest rate fair value hedges—Corporate ............. Other assets $ 8.0 $ 31.0 Other liabilities $ 1.6 $ —
Foreign currency cash flow hedges—Consumer-to-
consumer ....................................................... Other assets 14.7 15.1 Other liabilities 31.1 31.0
Total ................................................................. $ 22.7 $ 46.1 $ 32.7 $ 31.0
Derivatives—undesignated:
Foreign currency—Global business payments......... Other assets $ 46.9 $ 58.9 Other liabilities $ 36.2 $ 48.2
Foreign currency—Consumer-to-consumer............. Other assets 0.2 4.9 Other liabilities 12.0 1.4
Total ................................................................. $ 47.1 $ 63.8 $ 48.2 $ 49.6
Total derivatives ........................................................ $ 69.8 $ 109.9 $ 80.9 $ 80.6
The following table summarizes the net fair value of derivatives held at December 31, 2010 and their expected
maturities (in millions):
Total 2011 2012 2013 2014 Thereafter
Foreign currency cash flow hedges—Consumer-to-consumer ................. $ (16.4) $ (9.6) $ (6.8) $ — $ — $ —
Foreign currency undesignated hedges—Consumer-to-consumer............. (11.8) (11.8) — — — —
Foreign currency undesignated hedges—Global business payments ......... 10.7 10.6 0.1 — — —
Interest rate fair value hedges—Corporate............................................ 6.4 3.8 — — 2.6 —
Total ................................................................................................ $ (11.1) $ (7.0) $ (6.7) $ — $ 2.6 $ —
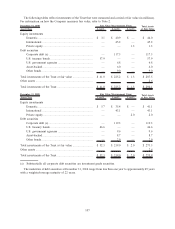
Income Statement
The following tables summarize the location and amount of gains and losses of derivatives in the Consolidated
Statements of Income segregated by designated, qualifying hedging instruments and those that are not, for the years
ended December 31, 2010, 2009 and 2008 (in millions):
Fair Value Hedges
Derivatives
Income Statement
Location 2010 2009 2008 Hedged Items
Income Statement
Location 2010 2009 2008
Amount Amount
Gain/(Loss) Recognized in Income on Related
Hedged Item (a)Gain/(Loss) Recognized in Income on Derivatives
Interest rate contracts ........ Interest expense $ 13.3 $ 12.9 $ 58.5 Fixed-rate debt Interest expense $ 10.5 $ 11.1 $ (54.6)
Total gain/(loss) ................ $ 13.3 $ 12.9 $ 58.5 $ 10.5 $ 11.1 $ (54.6)
113