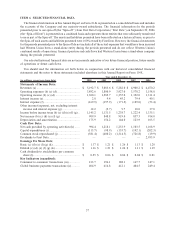
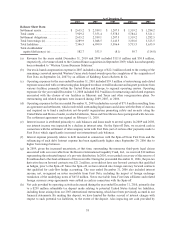
Western Union 2010 Annual Report Download - page 49
Download and view the complete annual report
Please find page 49 of the 2010 Western Union annual report below. You can navigate through the pages in the report by either clicking on the pages listed below, or by using the keyword search tool below to find specific information within the annual report.-
 1
1 -
2
-
3
-
4
-
5
-
6
-
7
-
8
-
9
-
10
-
11
-
12
-
13
-
14
-
15
-
16
-
17
-
18
-
19
-
20
-
21
-
22
-
23
-
24
-
25
-
26
-
27
-
28
-
29
-
30
-
31
-
32
-
33
-
34
-
35
-
36
-
37
-
38
-
 39
39 -
 40
40 -
 41
41 -
 42
42 -
 43
43 -
 44
44 -
 45
45 -
 46
46 -
 47
47 -
 48
48 -
 49
49 -
 50
50 -
 51
51 -
 52
52 -
 53
53 -
 54
54 -
 55
55 -
 56
56 -
 57
57 -
 58
58 -
 59
59 -
60
-
61
-
62
-
63
-
64
-
65
-
66
-
67
-
68
-
69
-
70
-
71
-
72
-
73
-
74
-
75
-
76
-
77
-
78
-
79
-
80
-
81
-
82
-
83
-
84
-
85
-
86
-
87
-
88
-
89
-
90
-
91
-
92
-
93
-
94
-
95
-
96
-
97
-
98
-
99
-
100
-
101
-
102
-
103
-
104
-
105
-
106
-
107
-
108
-
109
-
110
-
111
-
112
-
113
-
114
-
115
-
116
-
117
-
118
-
119
-
120
-
121
-
122
-
123
-
124
-
125
-
126
-
127
-
128
-
129
-
130
-
131
-
132
-
133
-
134
-
135
-
136
-
137
-
138
-
139
-
140
-
141
-
142
-
143
-
144
 |
 |
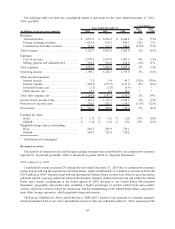
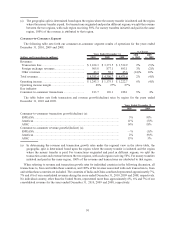
services as a percentage of revenue was 57% and 59% for the years ended December 31, 2009 and 2008,
respectively. The decrease in cost of services as a percentage of revenue for the year ended December 31, 2009
compared to the corresponding period in 2008 was generally due to reduced commissions resulting from the
acquisition of FEXCO and selective consumer-to-consumer agent commission initiatives, restructuring costs
incurred in 2008 which did not recur in 2009 and the related 2009 cost savings, offset somewhat by incremental
operating costs, including increased technology costs and costs associated with Custom House.
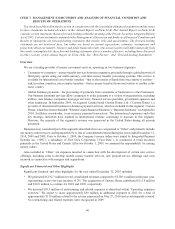
Selling, general and administrative
Selling, general and administrative expenses (“SG&A”) decreased for the year ended December 31, 2010
compared to the same period in the prior year due to the settlement accrual that was recorded in 2009, as described
below, lower marketing expenses and operating efficiencies, offset by incremental costs associated with Custom
House and our retail expansion in Europe pursuant to the Payment Services Directive, restructuring and related
expenses of $44.5 million and higher employee compensation costs.
SG&A increased for the year ended December 31, 2009 compared to the same period in the prior year due to the
settlement accrual described below, incremental costs associated with the acquisitions of FEXCO and Custom House
including costs related to evaluating and closing these acquisitions and other increased operating expenses, offset by
better leveraging of our marketing expenses, and restructuring costs incurred in 2008 which did not recur in 2009.
During the year ended December 31, 2009, we recorded an accrual of $71.0 million for an agreement and
settlement with the State of Arizona and other states. On February 11, 2010, we signed this agreement and settlement,
which resolved all outstanding legal issues and claims with the State and requires us to fund a multi-state not-for-profit
organization promoting safety and security along the United States and Mexico border, in which California, Texas and
New Mexico will participate with Arizona. The accrual includes amounts for reimbursement to the State of Arizona
for its costs associated with this matter. In addition, as part of the agreement and settlement, we expect to make certain
investments in our compliance programs along the United States and Mexico border and have engaged a monitor for
those programs, which are expected to cost up to $23 million over the period from signing to 2013.
During the years ended December 31, 2010, 2009 and 2008, marketing related expenditures, principally
classified within SG&A, were approximately 4%, 5%, and 5%, respectively, of revenue. Marketing related
expenditures include advertising, events, loyalty programs and the cost of employees dedicated to marketing
activities. When making decisions with respect to marketing investments, we review opportunities for advertising
and other marketing related expenditures together with opportunities for fee adjustments, as discussed in “Segment
Discussion,” for consumer-to-consumer revenues and other initiatives in order to best maximize the return on these
investments.
Total other expense, net
Total other expense, net increased during the year ended December 31, 2010 compared to 2009 primarily due to
an increase in interest expense resulting from our $250 million note issuance and financing costs incurred in
connection with our note exchange, and a decrease in interest income due to lower short-term interest rates and the
repayment of a note receivable due from an agent. These amounts were partially offset by the recovery of
$6.3 million of the $12 million reserve recorded in the prior year against our receivable from the Reserve
International Liquidity Fund due to the final settlement.
Total other expense, net increased during the year ended December 31, 2009 compared to 2008 due to a decrease
in interest income primarily due to lower short-term interest rates and lower average interest-bearing cash balances,
the reserve taken against our receivable from the Reserve International Liquidity Fund, Ltd. mentioned above and a
decline in earnings on our equity method investments in 2009, primarily as a result of the absence of equity method
earnings for FEXCO subsequent to the February 2009 acquisition date.
Income taxes
Our effective tax rates on pre-tax income were 20.5%, 25.0% and 25.8% for the years ended December 31, 2010,
2009 and 2008, respectively. We continue to benefit from an increasing proportion of profits being foreign-derived,
47