Western Union 2010 Annual Report Download - page 109
Download and view the complete annual report
Please find page 109 of the 2010 Western Union annual report below. You can navigate through the pages in the report by either clicking on the pages listed below, or by using the keyword search tool below to find specific information within the annual report.-
 1
1 -
2
-
3
-
4
-
5
-
6
-
7
-
8
-
9
-
10
-
11
-
12
-
13
-
14
-
15
-
16
-
17
-
18
-
19
-
20
-
21
-
22
-
23
-
24
-
25
-
26
-
27
-
28
-
29
-
30
-
31
-
32
-
33
-
34
-
35
-
36
-
37
-
38
-
39
-
40
-
41
-
42
-
43
-
44
-
45
-
46
-
47
-
48
-
49
-
50
-
51
-
52
-
53
-
54
-
55
-
56
-
57
-
58
-
59
-
60
-
61
-
62
-
63
-
64
-
65
-
66
-
67
-
68
-
69
-
70
-
71
-
72
-
73
-
74
-
75
-
76
-
77
-
78
-
79
-
80
-
81
-
82
-
83
-
84
-
85
-
86
-
87
-
88
-
89
-
90
-
91
-
92
-
93
-
94
-
95
-
96
-
97
-
98
-
 99
99 -
 100
100 -
 101
101 -
 102
102 -
 103
103 -
 104
104 -
 105
105 -
 106
106 -
 107
107 -
 108
108 -
 109
109 -
 110
110 -
 111
111 -
 112
112 -
 113
113 -
 114
114 -
 115
115 -
 116
116 -
 117
117 -
 118
118 -
 119
119 -
120
-
121
-
122
-
123
-
124
-
125
-
126
-
127
-
128
-
129
-
130
-
131
-
132
-
133
-
134
-
135
-
136
-
137
-
138
-
139
-
140
-
141
-
142
-
143
-
144
 |
 |

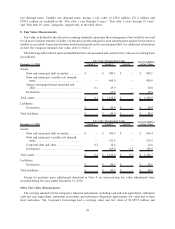
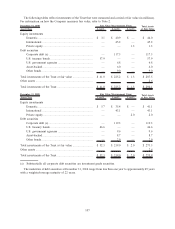
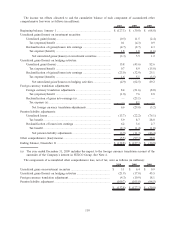
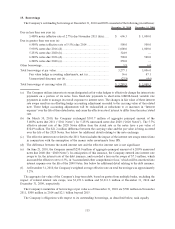
The following tables reflect investments of the Trust that were measured and carried at fair value (in millions).
For information on how the Company measures fair value, refer to Note 2.
Asset Class Level 1 Level 2 Level 3
Total Assets
at Fair Value
December 31, 2010 Fair Value Measurement Using
Equity investments
Domestic .................................................................. $ 3.1 $ 40.9 $ — $ 44.0
International ............................................................. — 45.2 — 45.2
Private equity ............................................................ — — 1.3 1.3
Debt securities
Corporate debt (a) ..................................................... — 117.3 — 117.3
U.S. treasury bonds ................................................... 57.9 — — 57.9
U.S. government agencies .......................................... — 6.8 — 6.8
Asset-backed............................................................. — 6.0 — 6.0
Other bonds .............................................................. — 9.0 — 9.0
Total investments of the Trust at fair value ........................ $ 61.0 $ 225.2 $ 1.3 $ 287.5
Other assets ..................................................................... 2.6
Total investments of the Trust ........................................... $ 61.0 $ 225.2 $ 1.3 $ 290.1
Asset Class Level 1 Level 2 Level 3
Total Assets
at Fair Value
December 31, 2009 Fair Value Measurement Using
Equity investments
Domestic .................................................................. $ 5.7 $ 35.4 $ — $ 41.1
International ............................................................. — 43.1 — 43.1
Private equity ............................................................ — — 2.0 2.0
Debt securities
Corporate debt (a) ..................................................... — 119.3 — 119.3
U.S. treasury bonds ................................................... 46.6 — — 46.6
U.S. government agencies .......................................... — 9.6 — 9.6
Asset-backed............................................................. — 8.7 — 8.7
Other bonds .............................................................. — 2.9 — 2.9
Total investments of the Trust at fair value ........................ $ 52.3 $ 219.0 $ 2.0 $ 273.3
Other assets ..................................................................... 2.6
Total investments of the Trust ........................................... $ 52.3 $ 219.0 $ 2.0 $ 275.9
(a) Substantially all corporate debt securities are investment grade securities.
The maturities of debt securities at December 31, 2010 range from less than one year to approximately 49 years
with a weighted-average maturity of 22 years.
107