Western Union 2010 Annual Report Download - page 126
Download and view the complete annual report
Please find page 126 of the 2010 Western Union annual report below. You can navigate through the pages in the report by either clicking on the pages listed below, or by using the keyword search tool below to find specific information within the annual report.-
 1
1 -
2
-
3
-
4
-
5
-
6
-
7
-
8
-
9
-
10
-
11
-
12
-
13
-
14
-
15
-
16
-
17
-
18
-
19
-
20
-
21
-
22
-
23
-
24
-
25
-
26
-
27
-
28
-
29
-
30
-
31
-
32
-
33
-
34
-
35
-
36
-
37
-
38
-
39
-
40
-
41
-
42
-
43
-
44
-
45
-
46
-
47
-
48
-
49
-
50
-
51
-
52
-
53
-
54
-
55
-
56
-
57
-
58
-
59
-
60
-
61
-
62
-
63
-
64
-
65
-
66
-
67
-
68
-
69
-
70
-
71
-
72
-
73
-
74
-
75
-
76
-
77
-
78
-
79
-
80
-
81
-
82
-
83
-
84
-
85
-
86
-
87
-
88
-
89
-
90
-
91
-
92
-
93
-
94
-
95
-
96
-
97
-
98
-
99
-
100
-
101
-
102
-
103
-
104
-
105
-
106
-
107
-
108
-
109
-
110
-
111
-
112
-
113
-
114
-
115
-
 116
116 -
 117
117 -
 118
118 -
 119
119 -
 120
120 -
 121
121 -
 122
122 -
 123
123 -
 124
124 -
 125
125 -
 126
126 -
 127
127 -
 128
128 -
 129
129 -
 130
130 -
 131
131 -
 132
132 -
 133
133 -
 134
134 -
 135
135 -
 136
136 -
137
-
138
-
139
-
140
-
141
-
142
-
143
-
144
 |
 |

Information concerning principal geographic areas was as follows (in millions):
2010 2009 2008
Years Ended December 31,
Revenue:
United States ............................................................................ $ 1,516.0 $ 1,584.9 $ 1,760.0
International ............................................................................. 3,676.7 3,498.7 3,522.0
Total ................................................................................................ $ 5,192.7 $ 5,083.6 $ 5,282.0
Long-lived assets:
United States ............................................................................ $ 159.4 $ 161.1 $ 162.3
International ............................................................................. 37.1 43.2 30.0
Total ................................................................................................ $ 196.5 $ 204.3 $ 192.3
The geographic split of revenue above for consumer-to-consumer is based upon the country where a money
transfer is initiated and the country where a money transfer is paid with revenue being split 50% between the two
countries. The geographic split of revenue above for global business payments is based upon the country where the
transaction is initiated with 100% of the revenue allocated to that country. Long-lived assets, consisting of “Property
and equipment, net,” are presented based upon the location of the assets.
A significant majority of the Company’s consumer-to-consumer transactions involve at least one non-United
States location. Based on the method used to attribute revenue between countries described in the paragraph above,
each individual country outside the United States accounted for less than 10% of revenue for the years ended
December 31, 2010, 2009 and 2008. In addition, each individual agent or global business payments customer
accounted for less than 10% of revenue during these periods.
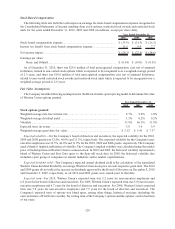
18. Quarterly Financial Information (Unaudited)
Summarized quarterly results for the years ended December 31, 2010 and 2009 were as follows (in millions,
except per share data):
2010 by Quarter: Q1 Q2 Q3 Q4
Year Ended
December 31,
2010
Revenues............................................... $ 1,232.7 $ 1,273.4 $ 1,329.6 $ 1,357.0 $5,192.7
Expenses (a) .......................................... 916.9 962.4 978.4 1,034.9 3,892.6
Other expense, net ................................. 39.8 38.7 42.6 33.8 154.9
Income before income taxes ................... 276.0 272.3 308.6 288.3 1,145.2
Provision for income taxes ..................... 68.1 51.3 70.2 45.7 235.3
Net income ........................................... $ 207.9 $ 221.0 $ 238.4 $ 242.6 $ 909.9
Earnings per share:
Basic ............................................. $ 0.30 $ 0.33 $ 0.36 $ 0.37 $ 1.37
Diluted .......................................... $ 0.30 $ 0.33 $ 0.36 $ 0.37 $ 1.36
Weighted-average shares outstanding:
Basic ............................................. 681.9 669.3 659.1 655.4 666.5
Diluted .......................................... 684.2 671.6 661.3 658.4 668.9
(a) Includes $34.5 million in the second quarter, $14.0 million in the third quarter and $11.0 in the fourth quarter
of restructuring and related expenses. For more information, see Note 3.
124