Western Union 2010 Annual Report Download - page 54
Download and view the complete annual report
Please find page 54 of the 2010 Western Union annual report below. You can navigate through the pages in the report by either clicking on the pages listed below, or by using the keyword search tool below to find specific information within the annual report.-
 1
1 -
2
-
3
-
4
-
5
-
6
-
7
-
8
-
9
-
10
-
11
-
12
-
13
-
14
-
15
-
16
-
17
-
18
-
19
-
20
-
21
-
22
-
23
-
24
-
25
-
26
-
27
-
28
-
29
-
30
-
31
-
32
-
33
-
34
-
35
-
36
-
37
-
38
-
39
-
40
-
41
-
42
-
43
-
 44
44 -
 45
45 -
 46
46 -
 47
47 -
 48
48 -
 49
49 -
 50
50 -
 51
51 -
 52
52 -
 53
53 -
 54
54 -
 55
55 -
 56
56 -
 57
57 -
 58
58 -
 59
59 -
 60
60 -
 61
61 -
 62
62 -
 63
63 -
 64
64 -
65
-
66
-
67
-
68
-
69
-
70
-
71
-
72
-
73
-
74
-
75
-
76
-
77
-
78
-
79
-
80
-
81
-
82
-
83
-
84
-
85
-
86
-
87
-
88
-
89
-
90
-
91
-
92
-
93
-
94
-
95
-
96
-
97
-
98
-
99
-
100
-
101
-
102
-
103
-
104
-
105
-
106
-
107
-
108
-
109
-
110
-
111
-
112
-
113
-
114
-
115
-
116
-
117
-
118
-
119
-
120
-
121
-
122
-
123
-
124
-
125
-
126
-
127
-
128
-
129
-
130
-
131
-
132
-
133
-
134
-
135
-
136
-
137
-
138
-
139
-
140
-
141
-
142
-
143
-
144
 |
 |
drive growth by increasing the number of locations available to send and receive money. We generally refer to
locations with more than 50% of transactions being initiated (versus paid) as “send locations” and to the balance of
locations as “receive locations.” Send locations are the engine that drives consumer-to-consumer revenue. They
contribute more transactions per location than receive locations. However, a wide network of receive locations is
necessary to build each corridor and to help ensure global distribution and convenience for consumers. The number
of send and receive transactions at an agent location can vary significantly due to such factors as customer
demographics around the location, migration patterns, the location’s class of trade, hours of operation, length of
time the location has been offering our services, regulatory limitations and competition. Each of the more than
445,000 agent locations in our agent network is capable of providing one or more of our services; however, not every
location completes a transaction in a given period. For example, as of December 31, 2010, more than 85% of agent
locations in the United States, Canada and Western Europe (representing at least one of our three money transfer
brands: Western Union», Orlandi Valuta
SM
and Vigo») experienced money transfer activity in the previous
12 months. In the developing regions of Asia and other areas where there are primarily receive locations,
approximately 70% of locations experienced money transfer activity in the previous 12 months. We
periodically review locations to determine whether they remain enabled to perform money transfer transactions.
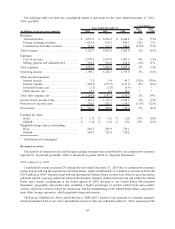
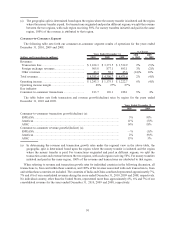
2009 compared to 2008
Consumer-to-consumer money transfer revenue declined 4% on transaction growth of 4% for the year ended
December 31, 2009 over 2008. The revenue decline was attributable to the weak global economy and slowing
transaction growth, and to a lesser extent, geographic mix, product mix including a higher percentage of revenue
earned from intra-country activity, which has lower revenue per transaction than cross-border transactions, and
price decreases. Also impacting the revenue decline was the strengthening of the United States dollar compared to
most other foreign currencies for the majority of the year, which adversely impacted revenue by approximately 2%,
as discussed below. Our international consumer-to-consumer business experienced a revenue decline of 1% on
transaction growth of 8% for the year ended December 31, 2009. Our international consumer-to-consumer business
outside of the United States also experienced revenue declines on transaction increases for the year ended
December 31, 2009 as a result of the same factors described above.
Revenue in our EMEASA region declined 1% during the year ended December 31, 2009 compared to the same
period in 2008 due to most of the same factors discussed above. Our largest European markets experienced revenue
declines during most of the year ended December 31, 2009 as compared to the same period in 2008. Our money
transfer business to India for the year ended December 31, 2009 versus the same period in 2008 continued to grow
with transaction growth of 22% and revenue growth of 11%. Revenue and transaction growth for both India and the
Gulf States slowed throughout the year ended December 31, 2009 compared to 2008. Due to the economic
conditions in the Gulf States, transaction growth rates declined to single digits in the fourth quarter.
Americas revenue and transactions declined for the year ended December 31, 2009 compared to the same period
in 2008. Contributing to the overall decline in the Americas region was the domestic business which experienced a
revenue decline of 14% on a transaction decline of 5% for the year ended December 31, 2009. The repositioning of
the domestic business, including pricing reductions taken in the United States in the fourth quarter of 2009,
improved our Americas and domestic transaction volumes, but contributed to the decline in revenue. Our Mexico
business also contributed to the overall decline in the Americas region with a revenue decline of 15% on a
transaction decline of 12% for the year ended December 31, 2009. Our United States domestic and Mexico business
revenue declined due to the weak economy in the United States. Our Mexico revenues were also impacted by our
closure of certain Vigo branded agents, substantially all of which were small retailers, due to credit concerns.
However, the decline in revenue for our United States outbound business moderated in the fourth quarter of 2009
compared to the previous nine months of 2009 as a result of transaction growth experienced in the fourth quarter of
2009.
Our APAC revenue increased 5% on transaction growth of 18% for the year ended December 31, 2009 compared
to the same period in 2008. The APAC region’s revenues have been impacted by translating foreign currency
denominated revenues into the United States dollar, as further described below, as well as moderating transaction
growth. China revenue grew 1% on 4% transaction growth for the year ended December 31, 2009.
52