Western Union 2010 Annual Report Download - page 47
Download and view the complete annual report
Please find page 47 of the 2010 Western Union annual report below. You can navigate through the pages in the report by either clicking on the pages listed below, or by using the keyword search tool below to find specific information within the annual report.-
 1
1 -
2
-
3
-
4
-
5
-
6
-
7
-
8
-
9
-
10
-
11
-
12
-
13
-
14
-
15
-
16
-
17
-
18
-
19
-
20
-
21
-
22
-
23
-
24
-
25
-
26
-
27
-
28
-
29
-
30
-
31
-
32
-
33
-
34
-
35
-
36
-
 37
37 -
 38
38 -
 39
39 -
 40
40 -
 41
41 -
 42
42 -
 43
43 -
 44
44 -
 45
45 -
 46
46 -
 47
47 -
 48
48 -
 49
49 -
 50
50 -
 51
51 -
 52
52 -
 53
53 -
 54
54 -
 55
55 -
 56
56 -
 57
57 -
58
-
59
-
60
-
61
-
62
-
63
-
64
-
65
-
66
-
67
-
68
-
69
-
70
-
71
-
72
-
73
-
74
-
75
-
76
-
77
-
78
-
79
-
80
-
81
-
82
-
83
-
84
-
85
-
86
-
87
-
88
-
89
-
90
-
91
-
92
-
93
-
94
-
95
-
96
-
97
-
98
-
99
-
100
-
101
-
102
-
103
-
104
-
105
-
106
-
107
-
108
-
109
-
110
-
111
-
112
-
113
-
114
-
115
-
116
-
117
-
118
-
119
-
120
-
121
-
122
-
123
-
124
-
125
-
126
-
127
-
128
-
129
-
130
-
131
-
132
-
133
-
134
-
135
-
136
-
137
-
138
-
139
-
140
-
141
-
142
-
143
-
144
 |
 |
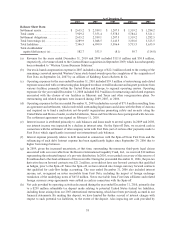
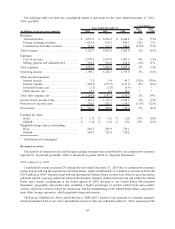
revenue despite transaction growth. Transaction growth was offset by the strengthening of the United States dollar
in the region compared to most other foreign currencies, which negatively impacted revenue, and many of the same
factors described above.
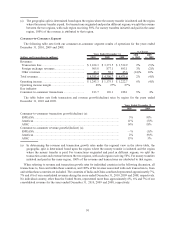
The Americas region (including North America, Latin America, the Caribbean and South America) of our
consumer-to-consumer segment, which represented 31% of our total consolidated revenue for the year ended
December 31, 2010, experienced revenue increases due to strong transaction growth, although the increase was
mostly offset by the impact of pricing actions taken in our domestic business in the fourth quarter of 2009.
The global business payments segment, which is discussed in greater detail in “Segment Discussion,” also
experienced revenue growth during the year ended December 31, 2010 compared to the prior year due to our
acquisition of Custom House, which was partially offset by declines in our United States bill payments businesses.
Foreign exchange revenues increased for the year ended December 31, 2010 over 2009 primarily due to foreign
exchange revenues contributed from our acquisition of Custom House. In addition to the impact of Custom House,
foreign exchange revenues in the consumer-to-consumer segment also grew, driven primarily by revenue from the
international business outside of the United States.
Fluctuations in the exchange rate between the United States dollar and currencies other than the United States
dollar have resulted in a reduction of transaction fee and foreign exchange revenue for the year ended December 31,
2010 of $36.8 million over the previous year, net of foreign currency hedges, that would not have occurred had there
been constant currency rates. The largest impact was related to the EMEASA region.
2009 compared to 2008
Consolidated revenue declined 4% during the year ended December 31, 2009. The revenue decline was
attributable to the weak global economy and slowing transaction growth, and to a lesser extent, geographic mix,
product mix including a higher percentage of revenue earned from intra-country activity, which has lower revenue
per transaction than cross-border transactions, and price decreases. Also impacting the revenue decline was the
strengthening of the United States dollar compared to most other foreign currencies for the majority of the year,
which adversely impacted revenue by approximately 3%, as discussed below.
The EMEASA region of our consumer-to-consumer segment, which represented 45% of our total consolidated
revenue for the year ended December 31, 2009, experienced revenue declines and slower transaction growth rates
during the year ended December 31, 2009 compared to the corresponding period in the prior year. The revenue
declines were driven by most of the same factors discussed above. The acquisition of FEXCO’s money transfer
business did not have an impact on our revenue as we were already recognizing 100% of the revenue arising from
money transfers originating at FEXCO’s locations.
The Americas region of our consumer-to-consumer segment, which represented 32% of our total consolidated
revenue for the year ended December 31, 2009, experienced revenue and transaction declines due to the overall weak
United States economy. Our Americas results were further impacted by pricing reductions taken in the United States in
the fourth quarter of 2009 which improved our transaction volumes, but contributed to the decline in revenue.
The global business payments segment, which is discussed in greater detail in “Segment Discussion,” also
experienced revenue declines during the year ended December 31, 2009 compared to the corresponding prior
period. Revenue was adversely impacted by the weak economic situation in the United States, which resulted in a
revenue decline in our United States cash and electronic bill payments businesses. Offsetting these declines in 2009
were the results of our Custom House acquisition, which contributed $30.8 million of revenue for the year ended
December 31, 2009.
Foreign exchange revenues increased for the year ended December 31, 2009 over 2008 primarily due to foreign
exchange revenues from Business Solutions. Excluding the impact of Business Solutions, foreign exchange
revenues decreased at a rate relatively consistent with the decrease in our revenue from our international
consumer-to-consumer business outside of the United States.
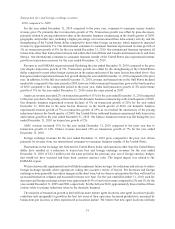
Fluctuations in the exchange rate between the United States dollar and currencies other than the United States
dollar have resulted in a reduction to transaction fee and foreign exchange revenue for the year ended December 31,
45