Western Union 2010 Annual Report Download - page 107
Download and view the complete annual report
Please find page 107 of the 2010 Western Union annual report below. You can navigate through the pages in the report by either clicking on the pages listed below, or by using the keyword search tool below to find specific information within the annual report.-
 1
1 -
2
-
3
-
4
-
5
-
6
-
7
-
8
-
9
-
10
-
11
-
12
-
13
-
14
-
15
-
16
-
17
-
18
-
19
-
20
-
21
-
22
-
23
-
24
-
25
-
26
-
27
-
28
-
29
-
30
-
31
-
32
-
33
-
34
-
35
-
36
-
37
-
38
-
39
-
40
-
41
-
42
-
43
-
44
-
45
-
46
-
47
-
48
-
49
-
50
-
51
-
52
-
53
-
54
-
55
-
56
-
57
-
58
-
59
-
60
-
61
-
62
-
63
-
64
-
65
-
66
-
67
-
68
-
69
-
70
-
71
-
72
-
73
-
74
-
75
-
76
-
77
-
78
-
79
-
80
-
81
-
82
-
83
-
84
-
85
-
86
-
87
-
88
-
89
-
90
-
91
-
92
-
93
-
94
-
95
-
96
-
 97
97 -
 98
98 -
 99
99 -
 100
100 -
 101
101 -
 102
102 -
 103
103 -
 104
104 -
 105
105 -
 106
106 -
 107
107 -
 108
108 -
 109
109 -
 110
110 -
 111
111 -
 112
112 -
 113
113 -
 114
114 -
 115
115 -
 116
116 -
 117
117 -
118
-
119
-
120
-
121
-
122
-
123
-
124
-
125
-
126
-
127
-
128
-
129
-
130
-
131
-
132
-
133
-
134
-
135
-
136
-
137
-
138
-
139
-
140
-
141
-
142
-
143
-
144
 |
 |

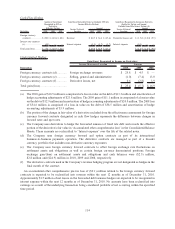
income over the average remaining life expectancy of the plan participants. Included in “Accumulated other
comprehensive loss” at December 31, 2010 is $8.1 million ($5.0 million, net of tax) of actuarial losses that are
expected to be recognized in net periodic pension cost during the year ended December 31, 2011.
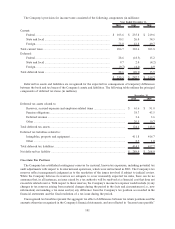
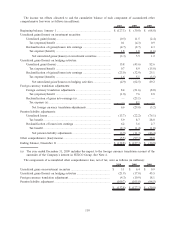
The following table provides the amounts recognized in the Consolidated Balance Sheets (in millions):
2010 2009
December 31,
Accrued benefit liability ........................................................................................ $ (112.8) $ (124.2)
Accumulated other comprehensive loss (pre-tax) ..................................................... 176.5 169.0
Net amount recognized .......................................................................................... $ 63.7 $ 44.8
The following table provides the components of net periodic benefit cost for the Plan (in millions):
2010 2009 2008
Year Ended December 31,
Interest cost ...................................................................................... $ 20.1 $ 23.6 $ 24.4
Expected return on plan assets ........................................................... (20.4) (24.7) (27.5)
Amortization of actuarial loss............................................................. 6.2 3.6 2.7
Employee termination costs................................................................ — — 2.8
Net periodic benefit cost .................................................................... $ 5.9 $ 2.5 $ 2.4
During 2008, the Company recorded $2.8 million of expense relating to the termination of certain retirement
eligible union and management plan participants in connection with the restructuring and related activities
disclosed in Note 3.
The accrued loss related to the pension liability included in accumulated other comprehensive loss, net of tax,
increased $3.9 million, $11.3 million and $46.4 million in 2010, 2009 and 2008, respectively. The significant increase
in the accrued loss included in accumulated other comprehensive loss in 2008 was caused by a decline in the fair value
of plan assets, which was primarily attributable to a decrease in the value of the equity securities within the plan asset
portfolio.
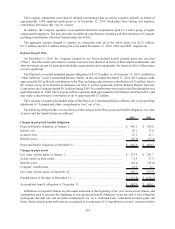
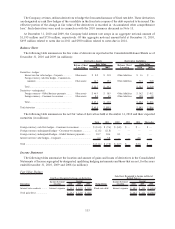
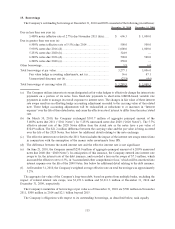
The rate assumptions used in the measurement of the Company’s benefit obligation were as follows:
2010 2009
Discount rate ..................................................................................................................... 4.69% 5.30%
The weighted-average rate assumptions used in the measurement of the Company’s net cost were as follows:
2010 2009 2008
Discount rate ....................................................................................................... 5.30% 6.26% 6.02%
Expected long-term return on plan assets .............................................................. 6.50% 7.50% 7.50%
The Company measures the Plan’s obligations and annual expense using assumptions that reflect best estimates
and are consistent to the extent that each assumption reflects expectations of future economic conditions. As the
bulk of the pension benefits will not be paid for many years, the computation of pension expenses and benefits is
based on assumptions about future interest rates and expected rates of return on plan assets. In general, pension
obligations are most sensitive to the discount rate assumption, and it is set based on the rate at which the pension
benefits could be settled effectively. The discount rate is determined by matching the timing and amount of
anticipated payouts under the Plan to the rates from an AA spot rate yield curve. The curve is derived from AA
bonds of varying maturities.
The Company employs a building block approach in determining the long-term rate of return for plan assets.
Historical markets are studied and long-term historical relationships between equities and fixed-income securities
are considered consistent with the widely accepted capital market principle that assets with higher volatility
generate a greater return over the long run. Current market factors such as inflation and interest rates are evaluated
105