Western Union 2010 Annual Report Download - page 48
Download and view the complete annual report
Please find page 48 of the 2010 Western Union annual report below. You can navigate through the pages in the report by either clicking on the pages listed below, or by using the keyword search tool below to find specific information within the annual report.-
 1
1 -
2
-
3
-
4
-
5
-
6
-
7
-
8
-
9
-
10
-
11
-
12
-
13
-
14
-
15
-
16
-
17
-
18
-
19
-
20
-
21
-
22
-
23
-
24
-
25
-
26
-
27
-
28
-
29
-
30
-
31
-
32
-
33
-
34
-
35
-
36
-
37
-
 38
38 -
 39
39 -
 40
40 -
 41
41 -
 42
42 -
 43
43 -
 44
44 -
 45
45 -
 46
46 -
 47
47 -
 48
48 -
 49
49 -
 50
50 -
 51
51 -
 52
52 -
 53
53 -
 54
54 -
 55
55 -
 56
56 -
 57
57 -
 58
58 -
59
-
60
-
61
-
62
-
63
-
64
-
65
-
66
-
67
-
68
-
69
-
70
-
71
-
72
-
73
-
74
-
75
-
76
-
77
-
78
-
79
-
80
-
81
-
82
-
83
-
84
-
85
-
86
-
87
-
88
-
89
-
90
-
91
-
92
-
93
-
94
-
95
-
96
-
97
-
98
-
99
-
100
-
101
-
102
-
103
-
104
-
105
-
106
-
107
-
108
-
109
-
110
-
111
-
112
-
113
-
114
-
115
-
116
-
117
-
118
-
119
-
120
-
121
-
122
-
123
-
124
-
125
-
126
-
127
-
128
-
129
-
130
-
131
-
132
-
133
-
134
-
135
-
136
-
137
-
138
-
139
-
140
-
141
-
142
-
143
-
144
 |
 |
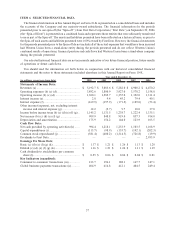
2009 of $119.5 million over the previous year, net of foreign currency hedges, that would not have occurred had
there been constant currency rates. The impact to earnings per share during the period was less than the revenue
impact due to the translation of expenses and our foreign currency hedging program. The majority of our foreign
currency exchange rate exposure is related to the EMEASA region.
Operating expenses overview
The following factors impacted both cost of services and selling, general and administrative expenses during the
periods presented:
•Restructuring and Related Activities—On May 25, 2010 and as subsequently revised, our Board of Directors
approved a restructuring plan (the “Restructuring Plan”) designed to reduce our overall headcount and
migrate positions from various facilities, primarily within the United States and Europe, to regional operating
centers upon completion of the Restructuring Plan. In conjunction with this decision and subsequent
revisions, we expect to incur approximately $50 million in additional expenses in 2011 related to the
Restructuring Plan. The total expense for 2010 and 2011 of approximately $110 million consists of
approximately $80 million for severance and employee related benefits, approximately $10 million for
facility closures, including lease terminations; and approximately $20 million for other expenses. Included in
these estimated expenses are approximately $2 million of non-cash expenses related to fixed asset and
leasehold improvement write-offs and accelerated depreciation at impacted facilities. Subject to complying
with and undertaking the necessary individual and collective employee information and consultation
obligations as may be required by local law for potentially affected employees, we expect all of these
activities to be completed by the third quarter of 2011. Total cost savings of approximately $8 million were
generated in 2010 and approximately $50 million is expected to be generated in 2011. Cost savings of
approximately $70 million per year are expected to be generated beginning in 2012, following completion of
the Restructuring Plan.
For the year ended December 31, 2010, restructuring and related expenses of $15.0 million are classified
within “cost of services” and $44.5 million are classified within “selling, general and administrative” in the
consolidated statements of income. No restructuring and related expenses were recognized in 2009.
For the year ended December 31, 2008, restructuring and related expenses of $62.8 million and $20.1 million
are classified within “cost of services” and “selling, general and administrative” expenses, respectively, in the
consolidated statements of income. These restructuring and related expenses are associated with the closure
of our facilities in Missouri and Texas and other reorganization plans executed in 2008. No expenses were
recognized for these restructurings in 2009.
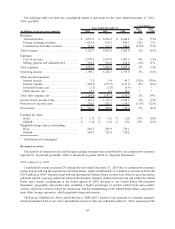
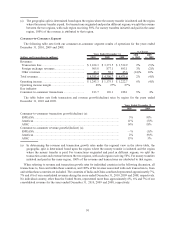
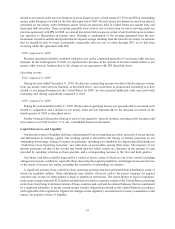
Cost of services
Cost of services increased for the year ended December 31, 2010 compared to the prior year primarily due to
incremental costs, including those related to Custom House, our money order business and advancing our electronic
channel initiatives, including our web and account based money transfer services; agent commissions, which
primarily increase in relation to revenue increases; and restructuring and related expenses of $15.0 million, offset by
operating efficiencies, primarily decreased bad debt expense. Cost of services as a percentage of revenue was 57%
for both of the years ended December 31, 2010 and 2009 as incremental operating costs, including costs associated
with our money order business and advancing our electronic channel initiatives, including our web and account
based money transfer services, and restructuring and related expenses were offset by operating efficiencies,
primarily decreased bad debt expense.
Cost of services decreased for the year ended December 31, 2009 compared to the corresponding period in 2008
primarily due to agent commissions, which decreased due to revenue declines, as well as reduced commissions
resulting from the acquisition of FEXCO and other selective consumer-to-consumer commission initiatives. Also
impacting cost of services was the strengthening of the United States dollar for most of 2009 compared to most other
foreign currencies, which resulted in a favorable impact on the translation of our expenses, and restructuring costs
incurred in 2008 which did not recur in 2009 and the related 2009 cost savings. These costs were offset by
incremental operating costs, including increased technology costs and costs associated with Custom House. Cost of
46