Western Union 2010 Annual Report Download - page 46
Download and view the complete annual report
Please find page 46 of the 2010 Western Union annual report below. You can navigate through the pages in the report by either clicking on the pages listed below, or by using the keyword search tool below to find specific information within the annual report.-
 1
1 -
2
-
3
-
4
-
5
-
6
-
7
-
8
-
9
-
10
-
11
-
12
-
13
-
14
-
15
-
16
-
17
-
18
-
19
-
20
-
21
-
22
-
23
-
24
-
25
-
26
-
27
-
28
-
29
-
30
-
31
-
32
-
33
-
34
-
35
-
 36
36 -
 37
37 -
 38
38 -
 39
39 -
 40
40 -
 41
41 -
 42
42 -
 43
43 -
 44
44 -
 45
45 -
 46
46 -
 47
47 -
 48
48 -
 49
49 -
 50
50 -
 51
51 -
 52
52 -
 53
53 -
 54
54 -
 55
55 -
 56
56 -
57
-
58
-
59
-
60
-
61
-
62
-
63
-
64
-
65
-
66
-
67
-
68
-
69
-
70
-
71
-
72
-
73
-
74
-
75
-
76
-
77
-
78
-
79
-
80
-
81
-
82
-
83
-
84
-
85
-
86
-
87
-
88
-
89
-
90
-
91
-
92
-
93
-
94
-
95
-
96
-
97
-
98
-
99
-
100
-
101
-
102
-
103
-
104
-
105
-
106
-
107
-
108
-
109
-
110
-
111
-
112
-
113
-
114
-
115
-
116
-
117
-
118
-
119
-
120
-
121
-
122
-
123
-
124
-
125
-
126
-
127
-
128
-
129
-
130
-
131
-
132
-
133
-
134
-
135
-
136
-
137
-
138
-
139
-
140
-
141
-
142
-
143
-
144
 |
 |

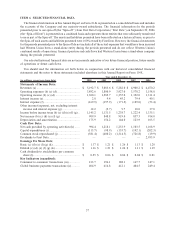
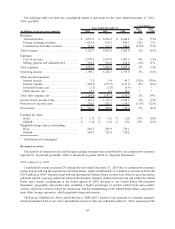
The following table sets forth our consolidated results of operations for the years ended December 31, 2010,
2009 and 2008.
(in millions, except per share amounts) 2010 2009 2008
2010
vs. 2009
2009
vs. 2008
Years Ended December 31,
% Change
Revenues:
Transaction fees .......................................... $ 4,055.3 $ 4,036.2 $ 4,240.8 —% (5)%
Foreign exchange revenues .......................... 1,018.8 910.3 896.3 12% 2%
Commission and other revenues ................... 118.6 137.1 144.9 (13)% (5)%
Total revenues ................................................ 5,192.7 5,083.6 5,282.0 2% (4)%
Expenses:
Cost of services .......................................... 2,978.4 2,874.9 3,093.0 4% (7)%
Selling, general and administrative ............... 914.2 926.0 834.0 (1)% 11%
Total expenses ................................................ 3,892.6 3,800.9 3,927.0 2% (3)%
Operating income ........................................... 1,300.1 1,282.7 1,355.0 1% (5)%
Other income/(expense):
Interest income ........................................... 2.8 9.4 45.2 (70)% (79)%
Interest expense .......................................... (169.9) (157.9) (171.2) 8% (8)%
Derivative losses, net ................................... (2.5) (2.8) (6.9) * *
Other income, net ....................................... 14.7 0.1 16.6 * *
Total other expense, net .................................. (154.9) (151.2) (116.3) 2% 30%
Income before income taxes ............................ 1,145.2 1,131.5 1,238.7 1% (9)%
Provision for income taxes .............................. 235.3 282.7 319.1 (17)% (12)%
Net income .................................................... $ 909.9 $ 848.8 $ 919.0 7% (8)%
Earnings per share:
Basic .......................................................... $ 1.37 $ 1.21 $ 1.26 13% (4)%
Diluted ....................................................... $ 1.36 $ 1.21 $ 1.24 12% (2)%
Weighted-average shares outstanding:
Basic .......................................................... 666.5 698.9 730.1
Diluted ....................................................... 668.9 701.0 738.2
* Calculation not meaningful
Revenues overview
The majority of transaction fees and foreign exchange revenues were contributed by our consumer-to-consumer
segment for all periods presented, which is discussed in greater detail in “Segment Discussion.”
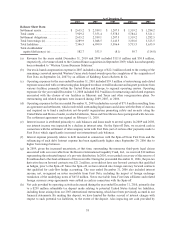
2010 compared to 2009
Consolidated revenue increased 2% during the year ended December 31, 2010 due to consumer-to-consumer
transaction growth and the acquisition of Custom House, which contributed $111.0 million to revenue in 2010 and
$30.8 million in 2009. Transaction growth and incremental Custom House revenue were offset by price decreases,
primarily related to pricing reductions taken in the domestic business (transactions between and within the United
States and Canada) commencing in the fourth quarter of 2009, declines in our United States bill payments
businesses, geographic and product mix, including a higher percentage of revenue earned from intra-country
activity, which has a lower revenue per transaction, and the strengthening of the United States dollar compared to
most other foreign currencies, which negatively impacted revenue.
The Europe, Middle East, Africa and South Asia (“EMEASA”) region of our consumer-to-consumer segment,
which represented 44% of our total consolidated revenue for the year ended December 31, 2010, experienced flat
44