Western Union 2010 Annual Report Download - page 110
Download and view the complete annual report
Please find page 110 of the 2010 Western Union annual report below. You can navigate through the pages in the report by either clicking on the pages listed below, or by using the keyword search tool below to find specific information within the annual report.-
 1
1 -
2
-
3
-
4
-
5
-
6
-
7
-
8
-
9
-
10
-
11
-
12
-
13
-
14
-
15
-
16
-
17
-
18
-
19
-
20
-
21
-
22
-
23
-
24
-
25
-
26
-
27
-
28
-
29
-
30
-
31
-
32
-
33
-
34
-
35
-
36
-
37
-
38
-
39
-
40
-
41
-
42
-
43
-
44
-
45
-
46
-
47
-
48
-
49
-
50
-
51
-
52
-
53
-
54
-
55
-
56
-
57
-
58
-
59
-
60
-
61
-
62
-
63
-
64
-
65
-
66
-
67
-
68
-
69
-
70
-
71
-
72
-
73
-
74
-
75
-
76
-
77
-
78
-
79
-
80
-
81
-
82
-
83
-
84
-
85
-
86
-
87
-
88
-
89
-
90
-
91
-
92
-
93
-
94
-
95
-
96
-
97
-
98
-
99
-
 100
100 -
 101
101 -
 102
102 -
 103
103 -
 104
104 -
 105
105 -
 106
106 -
 107
107 -
 108
108 -
 109
109 -
 110
110 -
 111
111 -
 112
112 -
 113
113 -
 114
114 -
 115
115 -
 116
116 -
 117
117 -
 118
118 -
 119
119 -
 120
120 -
121
-
122
-
123
-
124
-
125
-
126
-
127
-
128
-
129
-
130
-
131
-
132
-
133
-
134
-
135
-
136
-
137
-
138
-
139
-
140
-
141
-
142
-
143
-
144
 |
 |

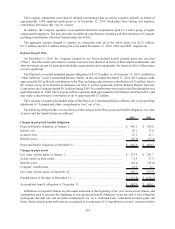
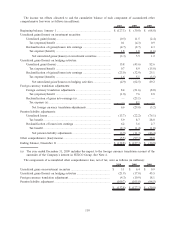
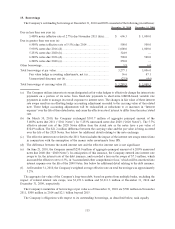
The following tables provide summaries of changes in the fair value of the Trust’s Level 3 financial assets (in
millions):
For the year ended December 31, 2010
Private equity
securities
Beginning balance, January 1, 2010 ......................................................................................... $ 2.0
Actual return on plan assets:
Relating to assets still held at the reporting date ................................................................ (0.4)
Relating to assets sold during the period ........................................................................... 0.2
Net purchases and sales ........................................................................................................... (0.5)
Ending balance, December 31, 2010 ........................................................................................ $ 1.3
For the year ended December 31, 2009
Asset-backed
securities
Private equity
securities Total
Beginning balance, January 1, 2009 ........................................... $ 9.8 $ 2.8 $ 12.6
Actual return on plan assets:
Relating to assets still held at the reporting date .................. 1.0 (0.8) 0.2
Relating to assets sold during the period ............................. 0.2 — 0.2
Net purchases and sales............................................................. (2.3) — (2.3)
Transfers out of Level 3 (a) ....................................................... (8.7) — (8.7)
Ending balance, December 31, 2009 .......................................... $ — $ 2.0 $ 2.0
(a) Market liquidity for these assets has significantly improved since 2008 resulting in improved price
transparency.
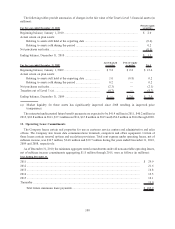
The estimated undiscounted future benefit payments are expected to be $41.4 million in 2011, $40.2 million in
2012, $38.8 million in 2013, $37.3 million in 2014, $35.8 million in 2015 and $154.2 million in 2016 through 2020.
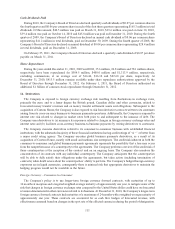
12. Operating Lease Commitments
The Company leases certain real properties for use as customer service centers and administrative and sales
offices. The Company also leases data communications terminals, computers and office equipment. Certain of
these leases contain renewal options and escalation provisions. Total rent expense under operating leases, net of
sublease income, was $34.7 million, $34.0 million and $39.7 million during the years ended December 31, 2010,
2009 and 2008, respectively.
As of December 31, 2010, the minimum aggregate rental commitments under all noncancelable operating leases,
net of sublease income commitments aggregating $1.8 million through 2015, were as follows (in millions):
Year Ending December 31,
2011 ......................................................................................................................................... $ 29.9
2012 ......................................................................................................................................... 21.6
2013 ......................................................................................................................................... 16.8
2014 ......................................................................................................................................... 12.5
2015 ......................................................................................................................................... 10.1
Thereafter ................................................................................................................................. 15.0
Total future minimum lease payments.................................................................................. $ 105.9
108