Toyota 2015 Annual Report Download - page 89
Download and view the complete annual report
Please find page 89 of the 2015 Toyota annual report below. You can navigate through the pages in the report by either clicking on the pages listed below, or by using the keyword search tool below to find specific information within the annual report.-
 1
1 -
2
-
3
-
4
-
5
-
6
-
7
-
8
-
9
-
10
-
11
-
12
-
13
-
14
-
15
-
16
-
17
-
18
-
19
-
20
-
21
-
22
-
23
-
24
-
25
-
26
-
27
-
28
-
29
-
30
-
31
-
32
-
33
-
34
-
35
-
36
-
37
-
38
-
39
-
40
-
41
-
42
-
43
-
44
-
45
-
46
-
47
-
48
-
49
-
50
-
51
-
52
-
53
-
54
-
55
-
56
-
57
-
58
-
59
-
60
-
61
-
62
-
63
-
64
-
65
-
66
-
67
-
68
-
69
-
70
-
71
-
72
-
73
-
74
-
75
-
76
-
77
-
78
-
 79
79 -
 80
80 -
 81
81 -
 82
82 -
 83
83 -
 84
84 -
 85
85 -
 86
86 -
 87
87 -
 88
88 -
 89
89 -
 90
90 -
 91
91 -
 92
92 -
 93
93 -
 94
94 -
 95
95 -
 96
96 -
 97
97 -
 98
98 -
 99
99 -
100
-
101
-
102
-
103
-
104
-
105
-
106
-
107
-
108
-
109
-
110
-
111
-
112
-
113
-
114
-
115
-
116
-
117
-
118
-
119
-
120
-
121
-
122
-
123
-
124
-
125
-
126
-
127
-
128
-
129
-
130
-
131
-
132
-
133
-
134
-
135
-
136
-
137
-
138
-
139
-
140
-
141
-
142
-
143
-
144
-
145
-
146
-
147
-
148
-
149
-
150
-
151
-
152
-
153
-
154
-
155
-
156
-
157
-
158
-
159
-
160
-
161
-
162
-
163
-
164
-
165
-
166
-
167
-
168
-
169
-
170
-
171
-
172
-
173
-
174
-
175
-
176
-
177
-
178
-
179
-
180
-
181
-
182
-
183
-
184
-
185
-
186
-
187
-
188
-
189
-
190
-
191
-
192
-
193
-
194
-
195
-
196
-
197
-
198
-
199
-
200
-
201
-
202
-
203
-
204
-
205
-
206
-
207
-
208
-
209
-
210
-
211
-
212
-
213
-
214
-
215
-
216
-
217
-
218
-
219
-
220
-
221
-
222
-
223
-
224
-
225
-
226
-
227
-
228
 |
 |

Toyota evaluates the recoverability of the carrying values of its leased vehicles for impairment when there are
indications of declines in residual values, and if impaired, Toyota recognizes an allowance for losses on its
residual values.
Throughout the life of the lease, management performs periodic evaluations of estimated end-of-term fair
values to determine whether estimates used in the determination of the contractual residual value are still
considered reasonable. Factors affecting the estimated residual value at lease maturity include, but are not limited
to, new vehicle incentive programs, new vehicle pricing, used vehicle supply, projected vehicle return rates, and
projected loss severity. The vehicle return rate represents the number of leased vehicles actually returned at
contract maturity as a percentage of the number of lease contracts originally scheduled to mature in the same
period less lease contracts subject to early terminations. A higher rate of vehicle returns exposes Toyota to higher
potential losses incurred at lease termination. Severity of loss is the extent to which the end-of-term fair value of
a lease is less than its carrying value at lease end.
To the extent that sales incentives remain an integral part of sales promotion, resale prices of used vehicles
and, correspondingly, the fair value of Toyota’s leased vehicles could be subject to downward pressure. The
extent of the impact this will have on the end of term residual value depends on the significance of the incentive
programs and whether they are sustained over a number of periods. This in turn can impact the projection of
future used vehicle values, adversely impacting the expected residual value of the current operating lease
portfolio and increasing the provision for residual value losses. However, various other factors impact used
vehicle values and the projection of future residual values, including the supply of and demand for used vehicles,
interest rates, inflation, the actual or perceived quality, safety and reliability of vehicles, the general economic
outlook, new vehicle pricing, projected vehicle return rates and projected loss severity, which may offset this
effect. Such factors may adversely affect the results of operations for financial services due to significant charges
reducing the estimated residual value.
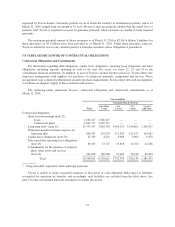
Sensitivity analysis
The following table illustrates the effect of an assumed change in the vehicle return rate and end-of-term
market values mainly in the United States, which Toyota believes are the critical estimates, in determining the
residual value losses, holding all other assumptions constant. The following table represents the impact on the
residual value losses in Toyota’s financial services operations of the change in vehicle return rate and
end-of-term market values as those changes have a significant impact on financial services operations.
Yen in millions
Effect on the residual value losses
over the remaining terms
of the operating leases
on and after April 1, 2016
1 percent increase in vehicle return rate .................................. 2,592
1 percent increase in end-of-term market values ............................ 10,592
Impairment of Long-Lived Assets
Toyota periodically reviews the carrying value of its long-lived assets held and used and assets to be
disposed of, including intangible assets, when events and circumstances warrant such a review. This review is
performed using estimates of future cash flows. If the carrying value of a long-lived asset is considered impaired,
an impairment charge is recorded for the amount by which the carrying value of the long-lived asset exceeds its
fair value. Management believes that the estimates of future cash flows and fair values are reasonable. However,
changes in estimates of such cash flows and fair values would affect the evaluations and negatively affect future
operating results of the automotive operations. In fiscal 2014, Toyota recorded long-lived assets impairment
charges relating to the end of production in Australia and recorded additional charges in fiscal 2015. See note 28
to the consolidated financial statements for further discussion.
84