Toyota 2015 Annual Report Download - page 197
Download and view the complete annual report
Please find page 197 of the 2015 Toyota annual report below. You can navigate through the pages in the report by either clicking on the pages listed below, or by using the keyword search tool below to find specific information within the annual report.-
 1
1 -
2
-
3
-
4
-
5
-
6
-
7
-
8
-
9
-
10
-
11
-
12
-
13
-
14
-
15
-
16
-
17
-
18
-
19
-
20
-
21
-
22
-
23
-
24
-
25
-
26
-
27
-
28
-
29
-
30
-
31
-
32
-
33
-
34
-
35
-
36
-
37
-
38
-
39
-
40
-
41
-
42
-
43
-
44
-
45
-
46
-
47
-
48
-
49
-
50
-
51
-
52
-
53
-
54
-
55
-
56
-
57
-
58
-
59
-
60
-
61
-
62
-
63
-
64
-
65
-
66
-
67
-
68
-
69
-
70
-
71
-
72
-
73
-
74
-
75
-
76
-
77
-
78
-
79
-
80
-
81
-
82
-
83
-
84
-
85
-
86
-
87
-
88
-
89
-
90
-
91
-
92
-
93
-
94
-
95
-
96
-
97
-
98
-
99
-
100
-
101
-
102
-
103
-
104
-
105
-
106
-
107
-
108
-
109
-
110
-
111
-
112
-
113
-
114
-
115
-
116
-
117
-
118
-
119
-
120
-
121
-
122
-
123
-
124
-
125
-
126
-
127
-
128
-
129
-
130
-
131
-
132
-
133
-
134
-
135
-
136
-
137
-
138
-
139
-
140
-
141
-
142
-
143
-
144
-
145
-
146
-
147
-
148
-
149
-
150
-
151
-
152
-
153
-
154
-
155
-
156
-
157
-
158
-
159
-
160
-
161
-
162
-
163
-
164
-
165
-
166
-
167
-
168
-
169
-
170
-
171
-
172
-
173
-
174
-
175
-
176
-
177
-
178
-
179
-
180
-
181
-
182
-
183
-
184
-
185
-
186
-
 187
187 -
 188
188 -
 189
189 -
 190
190 -
 191
191 -
 192
192 -
 193
193 -
 194
194 -
 195
195 -
 196
196 -
 197
197 -
 198
198 -
 199
199 -
 200
200 -
 201
201 -
 202
202 -
 203
203 -
 204
204 -
 205
205 -
 206
206 -
 207
207 -
208
-
209
-
210
-
211
-
212
-
213
-
214
-
215
-
216
-
217
-
218
-
219
-
220
-
221
-
222
-
223
-
224
-
225
-
226
-
227
-
228
 |
 |
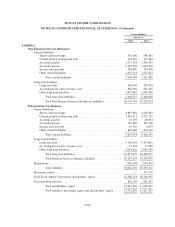
TOYOTA MOTOR CORPORATION
NOTES TO CONSOLIDATED FINANCIAL STATEMENTS—(Continued)
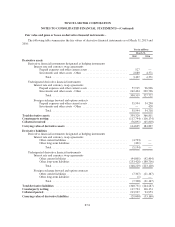
Cash flows from transactions of derivative financial instruments are included in cash flows from operating
activities in the consolidated statements of cash flows.
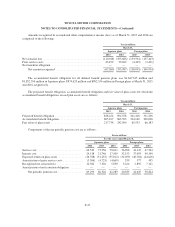
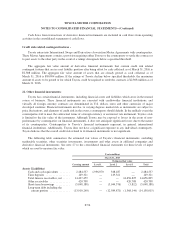
Credit risk related contingent features -
Toyota enters into International Swaps and Derivatives Association Master Agreements with counterparties.
These Master Agreements contain a provision requiring either Toyota or the counterparty to settle the contract or
to post assets to the other party in the event of a ratings downgrade below a specified threshold.
The aggregate fair value amount of derivative financial instruments that contain credit risk related
contingent features that are in a net liability position after being offset by cash collateral as of March 31, 2016 is
¥2,308 million. The aggregate fair value amount of assets that are already posted as cash collateral as of
March 31, 2016 is ¥80,904 million. If the ratings of Toyota decline below specified thresholds, the maximum
amount of assets to be posted or for which Toyota could be required to settle the contracts is ¥2,308 million as of
March 31, 2016.
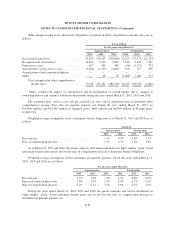
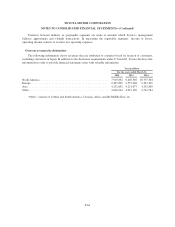
22. Other financial instruments:
Toyota has certain financial instruments, including financial assets and liabilities which arose in the normal
course of business. These financial instruments are executed with creditworthy financial institutions, and
virtually all foreign currency contracts are denominated in U.S. dollars, euros and other currencies of major
developed countries. Financial instruments involve, to varying degrees, market risk as instruments are subject to
price fluctuations, and elements of credit risk in the event a counterparty should default. In the unlikely event the
counterparties fail to meet the contractual terms of a foreign currency or an interest rate instrument, Toyota’s risk
is limited to the fair value of the instrument. Although Toyota may be exposed to losses in the event of non-
performance by counterparties on financial instruments, it does not anticipate significant losses due to the nature
of its counterparties. Counterparties to Toyota’s financial instruments represent, in general, international
financial institutions. Additionally, Toyota does not have a significant exposure to any individual counterparty.
Toyota believes that the overall credit risk related to its financial instruments is not significant.
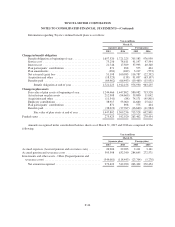
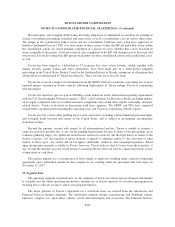
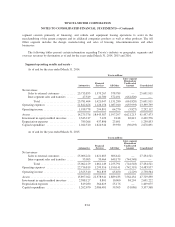
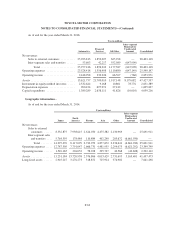
The following table summarizes the estimated fair values of Toyota’s financial instruments, excluding
marketable securities, other securities investments, investments and other assets in affiliated companies and
derivative financial instruments. See note 27 to the consolidated financial statements for three levels of input
which are used to measure fair value.
Yen in millions
March 31, 2015
Estimated fair value
Carrying amount Level 1 Level 2 Level 3 Total
Assets (Liabilities)
Cash and cash equivalents ....... 2,284,557 1,936,070 348,487 — 2,284,557
Time deposits ................. 149,321 — 149,321 — 149,321
Total finance receivables, net ..... 14,437,459 — — 14,656,825 14,656,825
Other receivables .............. 420,708 — — 420,708 420,708
Short-term borrowings .......... (5,048,188) — (5,044,376) (3,812) (5,048,188)
Long-term debt including the
current portion .............. (13,910,240) — (12,589,871) (1,568,144) (14,158,015)
F-56