Toyota 2015 Annual Report Download - page 79
Download and view the complete annual report
Please find page 79 of the 2015 Toyota annual report below. You can navigate through the pages in the report by either clicking on the pages listed below, or by using the keyword search tool below to find specific information within the annual report.-
 1
1 -
2
-
3
-
4
-
5
-
6
-
7
-
8
-
9
-
10
-
11
-
12
-
13
-
14
-
15
-
16
-
17
-
18
-
19
-
20
-
21
-
22
-
23
-
24
-
25
-
26
-
27
-
28
-
29
-
30
-
31
-
32
-
33
-
34
-
35
-
36
-
37
-
38
-
39
-
40
-
41
-
42
-
43
-
44
-
45
-
46
-
47
-
48
-
49
-
50
-
51
-
52
-
53
-
54
-
55
-
56
-
57
-
58
-
59
-
60
-
61
-
62
-
63
-
64
-
65
-
66
-
67
-
68
-
 69
69 -
 70
70 -
 71
71 -
 72
72 -
 73
73 -
 74
74 -
 75
75 -
 76
76 -
 77
77 -
 78
78 -
 79
79 -
 80
80 -
 81
81 -
 82
82 -
 83
83 -
 84
84 -
 85
85 -
 86
86 -
 87
87 -
 88
88 -
 89
89 -
90
-
91
-
92
-
93
-
94
-
95
-
96
-
97
-
98
-
99
-
100
-
101
-
102
-
103
-
104
-
105
-
106
-
107
-
108
-
109
-
110
-
111
-
112
-
113
-
114
-
115
-
116
-
117
-
118
-
119
-
120
-
121
-
122
-
123
-
124
-
125
-
126
-
127
-
128
-
129
-
130
-
131
-
132
-
133
-
134
-
135
-
136
-
137
-
138
-
139
-
140
-
141
-
142
-
143
-
144
-
145
-
146
-
147
-
148
-
149
-
150
-
151
-
152
-
153
-
154
-
155
-
156
-
157
-
158
-
159
-
160
-
161
-
162
-
163
-
164
-
165
-
166
-
167
-
168
-
169
-
170
-
171
-
172
-
173
-
174
-
175
-
176
-
177
-
178
-
179
-
180
-
181
-
182
-
183
-
184
-
185
-
186
-
187
-
188
-
189
-
190
-
191
-
192
-
193
-
194
-
195
-
196
-
197
-
198
-
199
-
200
-
201
-
202
-
203
-
204
-
205
-
206
-
207
-
208
-
209
-
210
-
211
-
212
-
213
-
214
-
215
-
216
-
217
-
218
-
219
-
220
-
221
-
222
-
223
-
224
-
225
-
226
-
227
-
228
 |
 |

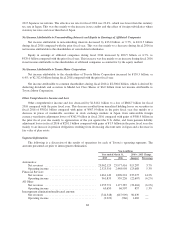
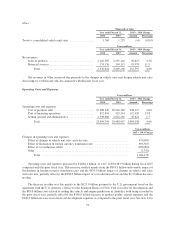
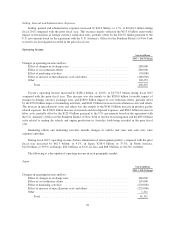
Other
Thousands of units
Year ended March 31, 2015 v. 2014 Change
2014 2015 Amount Percentage
Toyota’s consolidated vehicle unit sales ................. 1,769 1,755 (14) (0.8)%
Yen in millions
Year ended March 31, 2015 v. 2014 Change
2014 2015 Amount Percentage
Net revenues:
Sales of products ............................... 2,162,505 2,255,122 92,617 4.3%
Financial services ............................... 174,136 194,115 19,979 11.5
Total ..................................... 2,336,641 2,449,238 112,597 4.8%
Net revenues in Other increased due primarily to the changes in vehicle sales mix despite vehicle unit sales
decreasing by 14 thousand vehicles compared with the prior fiscal year.
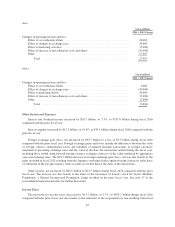
Operating Costs and Expenses
Yen in millions
Year ended March 31, 2015 v. 2014 Change
2014 2015 Amount Percentage
Operating costs and expenses
Cost of products sold ............................ 19,988,245 20,916,362 928,117 4.6%
Cost of financing operations ...................... 812,894 925,314 112,420 13.8
Selling, general and administrative ................. 2,598,660 2,642,281 43,621 1.7
Total ..................................... 23,399,799 24,483,957 1,084,158 4.6%
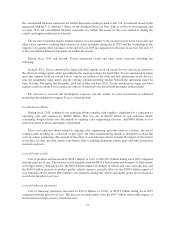
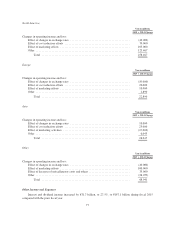
Yen in millions
2015 v. 2014 Change
Changes in operating costs and expenses:
Effect of changes in vehicle unit sales and sales mix ............................. 470,000
Effect of fluctuation in foreign currency translation rates ......................... 895,500
Effect of cost reduction efforts .............................................. (280,000)
Other .................................................................. (1,342)
Total .............................................................. 1,084,158
Operating costs and expenses increased by ¥1,084.1 billion, or 4.6%, to ¥24,483.9 billion during fiscal 2015
compared with the prior fiscal year. This increase resulted mainly from the ¥895.5 billion unfavorable impact of
fluctuations in foreign currency translation rates and the ¥470.0 billion impact of changes in vehicle unit sales
and sales mix, partially offset by the ¥280.0 billion impact of cost reduction efforts and the ¥1.3 billion decrease
in other.
The decrease in other was due mainly to the ¥125.0 billion payment to the U.S. government based on the
agreement with the U.S. Attorney’s Office for the Southern District of New York to resolve its investigation and
the ¥83.0 billion costs related to ending the vehicle and engine production in Australia, both being recorded in
the prior fiscal year, partially offset by the ¥140.0 billion increase in product quality related expenses and the
¥100.0 billion increase in research and development expenses as compared to the prior fiscal year. See note 24 to
74