Toyota 2015 Annual Report Download - page 174
Download and view the complete annual report
Please find page 174 of the 2015 Toyota annual report below. You can navigate through the pages in the report by either clicking on the pages listed below, or by using the keyword search tool below to find specific information within the annual report.-
 1
1 -
2
-
3
-
4
-
5
-
6
-
7
-
8
-
9
-
10
-
11
-
12
-
13
-
14
-
15
-
16
-
17
-
18
-
19
-
20
-
21
-
22
-
23
-
24
-
25
-
26
-
27
-
28
-
29
-
30
-
31
-
32
-
33
-
34
-
35
-
36
-
37
-
38
-
39
-
40
-
41
-
42
-
43
-
44
-
45
-
46
-
47
-
48
-
49
-
50
-
51
-
52
-
53
-
54
-
55
-
56
-
57
-
58
-
59
-
60
-
61
-
62
-
63
-
64
-
65
-
66
-
67
-
68
-
69
-
70
-
71
-
72
-
73
-
74
-
75
-
76
-
77
-
78
-
79
-
80
-
81
-
82
-
83
-
84
-
85
-
86
-
87
-
88
-
89
-
90
-
91
-
92
-
93
-
94
-
95
-
96
-
97
-
98
-
99
-
100
-
101
-
102
-
103
-
104
-
105
-
106
-
107
-
108
-
109
-
110
-
111
-
112
-
113
-
114
-
115
-
116
-
117
-
118
-
119
-
120
-
121
-
122
-
123
-
124
-
125
-
126
-
127
-
128
-
129
-
130
-
131
-
132
-
133
-
134
-
135
-
136
-
137
-
138
-
139
-
140
-
141
-
142
-
143
-
144
-
145
-
146
-
147
-
148
-
149
-
150
-
151
-
152
-
153
-
154
-
155
-
156
-
157
-
158
-
159
-
160
-
161
-
162
-
163
-
 164
164 -
 165
165 -
 166
166 -
 167
167 -
 168
168 -
 169
169 -
 170
170 -
 171
171 -
 172
172 -
 173
173 -
 174
174 -
 175
175 -
 176
176 -
 177
177 -
 178
178 -
 179
179 -
 180
180 -
 181
181 -
 182
182 -
 183
183 -
 184
184 -
185
-
186
-
187
-
188
-
189
-
190
-
191
-
192
-
193
-
194
-
195
-
196
-
197
-
198
-
199
-
200
-
201
-
202
-
203
-
204
-
205
-
206
-
207
-
208
-
209
-
210
-
211
-
212
-
213
-
214
-
215
-
216
-
217
-
218
-
219
-
220
-
221
-
222
-
223
-
224
-
225
-
226
-
227
-
228
 |
 |
TOYOTA MOTOR CORPORATION
NOTES TO CONSOLIDATED FINANCIAL STATEMENTS—(Continued)
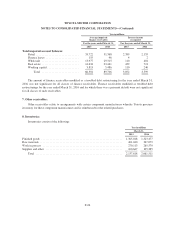
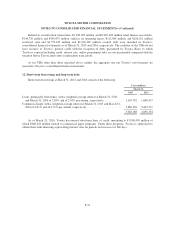
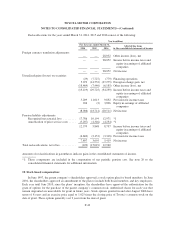
Standard agreements with certain banks include provisions that collateral (including sums on deposit with
such banks) or guarantees will be furnished upon the banks’ request and that any collateral furnished, pursuant to
such agreements or otherwise, will be applicable to all present or future indebtedness to such banks. During the
year ended March 31, 2016, Toyota has not received any significant requests from these banks.
As of March 31, 2016, Toyota has unused long-term lines of credit amounting to ¥7,223,398 million.
Interest expense during the years ended March 31, 2014, 2015 and 2016 were ¥316,054 million, ¥347,030
million and ¥377,310 million, respectively. Interest expense related to the financial services business is included
in “Cost of financing operations” in the accompanying consolidated statements of income.
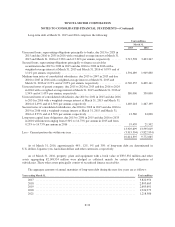
13. Product warranties and recalls and other safety measures:
Toyota provides product warranties for certain defects mainly resulting from manufacturing based on
warranty contracts with its customers at the time of sale of products. Toyota accrues estimated warranty costs to
be incurred in the future in accordance with the warranty contracts. In addition to product warranties, Toyota
initiates recalls and other safety measures to repair or to replace parts which might be expected to fail from
products safety perspectives or customer satisfaction standpoints. Toyota accrues for costs of recalls and other
safety measures at the time of vehicle sale based on the amount estimated from historical experience.
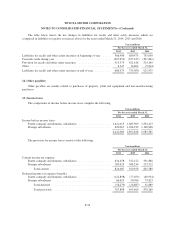
Liabilities for product warranties and liabilities for recalls and other safety measures have been combined
into a single table showing an aggregate liability for quality assurances due to the fact that both are liabilities for
costs to repair or replace defects of vehicles and the amounts incurred for recalls and other safety measures may
affect the amounts incurred for product warranties and vice versa.
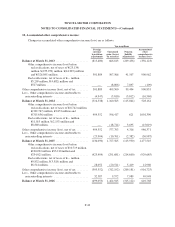
Liabilities for quality assurances are included in “Accrued expenses” in the consolidated balance sheets.
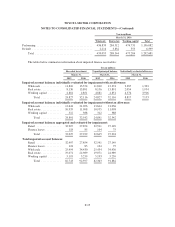
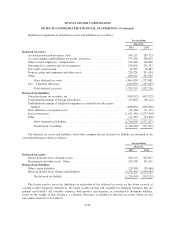
The net changes in liabilities for quality assurances above for the years ended March 31, 2014, 2015 and
2016 consist of the following:
Yen in millions
For the years ended March 31,
2014 2015 2016
Liabilities for quality assurances at beginning of year .................. 1,003,023 1,154,021 1,328,916
Payments made during year ...................................... (383,572) (509,488) (501,073)
Provision for quality assurances ................................... 524,442 686,006 636,719
Changes relating to pre-existing quality assurances .................... (7,248) (25,619) (39,225)
Other ........................................................ 17,376 23,996 (21,573)
Liabilities for quality assurances at end of year ....................... 1,154,021 1,328,916 1,403,764
“Other” primarily includes the impact of currency translation adjustments and the impact of consolidation
and deconsolidation of certain entities due to changes in ownership interest.
F-33