Toyota 2015 Annual Report Download - page 71
Download and view the complete annual report
Please find page 71 of the 2015 Toyota annual report below. You can navigate through the pages in the report by either clicking on the pages listed below, or by using the keyword search tool below to find specific information within the annual report.-
 1
1 -
2
-
3
-
4
-
5
-
6
-
7
-
8
-
9
-
10
-
11
-
12
-
13
-
14
-
15
-
16
-
17
-
18
-
19
-
20
-
21
-
22
-
23
-
24
-
25
-
26
-
27
-
28
-
29
-
30
-
31
-
32
-
33
-
34
-
35
-
36
-
37
-
38
-
39
-
40
-
41
-
42
-
43
-
44
-
45
-
46
-
47
-
48
-
49
-
50
-
51
-
52
-
53
-
54
-
55
-
56
-
57
-
58
-
59
-
60
-
 61
61 -
 62
62 -
 63
63 -
 64
64 -
 65
65 -
 66
66 -
 67
67 -
 68
68 -
 69
69 -
 70
70 -
 71
71 -
 72
72 -
 73
73 -
 74
74 -
 75
75 -
 76
76 -
 77
77 -
 78
78 -
 79
79 -
 80
80 -
 81
81 -
82
-
83
-
84
-
85
-
86
-
87
-
88
-
89
-
90
-
91
-
92
-
93
-
94
-
95
-
96
-
97
-
98
-
99
-
100
-
101
-
102
-
103
-
104
-
105
-
106
-
107
-
108
-
109
-
110
-
111
-
112
-
113
-
114
-
115
-
116
-
117
-
118
-
119
-
120
-
121
-
122
-
123
-
124
-
125
-
126
-
127
-
128
-
129
-
130
-
131
-
132
-
133
-
134
-
135
-
136
-
137
-
138
-
139
-
140
-
141
-
142
-
143
-
144
-
145
-
146
-
147
-
148
-
149
-
150
-
151
-
152
-
153
-
154
-
155
-
156
-
157
-
158
-
159
-
160
-
161
-
162
-
163
-
164
-
165
-
166
-
167
-
168
-
169
-
170
-
171
-
172
-
173
-
174
-
175
-
176
-
177
-
178
-
179
-
180
-
181
-
182
-
183
-
184
-
185
-
186
-
187
-
188
-
189
-
190
-
191
-
192
-
193
-
194
-
195
-
196
-
197
-
198
-
199
-
200
-
201
-
202
-
203
-
204
-
205
-
206
-
207
-
208
-
209
-
210
-
211
-
212
-
213
-
214
-
215
-
216
-
217
-
218
-
219
-
220
-
221
-
222
-
223
-
224
-
225
-
226
-
227
-
228
 |
 |

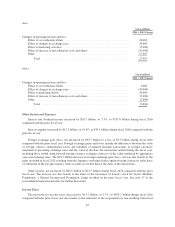
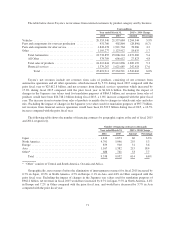
others. The increase in miscellaneous costs and others was due to the ¥110.0 billion increase in labor costs, the
¥50.0 billion increase in research and development expenses, the ¥50.0 billion increase in depreciation expenses
and the ¥130.0 billion increase in other various costs.
Marketing activities and marketing efforts include changes in vehicle unit sales and sales mix, sales
expenses and other.
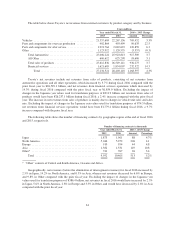
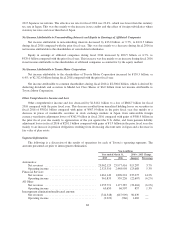
During fiscal 2016, operating income (before elimination of intersegment profits) compared with the prior
fiscal year increased by ¥106.0 billion, or 6.7%, in Japan, and ¥27.4 billion, or 6.5%, in Asia, whereas it
decreased by ¥55.7 billion, or 9.5%, in North America, ¥8.7 billion, or 10.7%, in Europe, and ¥2.6 billion, or
2.3%, in Other.
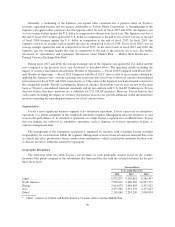
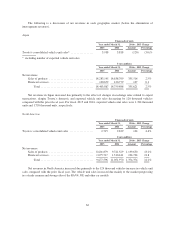
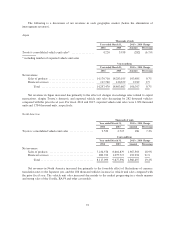
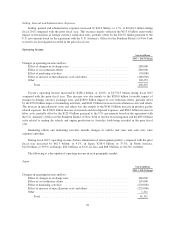
The following is a description of operating income in each geographic market.
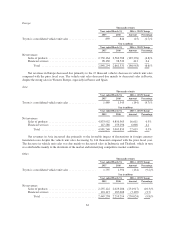
Japan
Yen in millions
2016 v. 2015 Change
Changes in operating income and loss:
Effect of cost reduction efforts .............................................. 275,000
Effect of changes in exchange rates .......................................... 270,000
Effect of marketing activities ............................................... (190,000)
Effect of increase of miscellaneous costs and others ............................. (255,000)
Other .................................................................. 6,046
Total .............................................................. 106,046
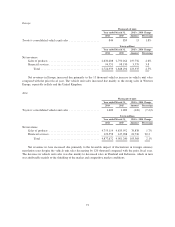
North America
Yen in millions
2016 v. 2015 Change
Changes in operating income and loss:
Effect of cost reduction efforts .............................................. 75,000
Effect of changes in exchange rates .......................................... (65,000)
Effect of marketing efforts ................................................. 5,000
Effect of increase of miscellaneous costs and others ............................. (75,000)
Other .................................................................. 4,300
Total .............................................................. (55,700)
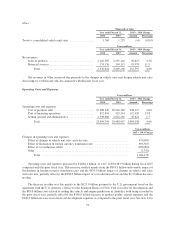
Europe
Yen in millions
2016 v. 2015 Change
Changes in operating income and loss:
Effect of cost reduction efforts .............................................. 15,000
Effect of changes in exchange rates .......................................... (30,000)
Effect of marketing efforts ................................................. 25,000
Effect of increase of miscellaneous costs and others ............................. (5,000)
Other .................................................................. (13,702)
Total .............................................................. (8,702)
66