Toyota 2015 Annual Report Download - page 171
Download and view the complete annual report
Please find page 171 of the 2015 Toyota annual report below. You can navigate through the pages in the report by either clicking on the pages listed below, or by using the keyword search tool below to find specific information within the annual report.-
 1
1 -
2
-
3
-
4
-
5
-
6
-
7
-
8
-
9
-
10
-
11
-
12
-
13
-
14
-
15
-
16
-
17
-
18
-
19
-
20
-
21
-
22
-
23
-
24
-
25
-
26
-
27
-
28
-
29
-
30
-
31
-
32
-
33
-
34
-
35
-
36
-
37
-
38
-
39
-
40
-
41
-
42
-
43
-
44
-
45
-
46
-
47
-
48
-
49
-
50
-
51
-
52
-
53
-
54
-
55
-
56
-
57
-
58
-
59
-
60
-
61
-
62
-
63
-
64
-
65
-
66
-
67
-
68
-
69
-
70
-
71
-
72
-
73
-
74
-
75
-
76
-
77
-
78
-
79
-
80
-
81
-
82
-
83
-
84
-
85
-
86
-
87
-
88
-
89
-
90
-
91
-
92
-
93
-
94
-
95
-
96
-
97
-
98
-
99
-
100
-
101
-
102
-
103
-
104
-
105
-
106
-
107
-
108
-
109
-
110
-
111
-
112
-
113
-
114
-
115
-
116
-
117
-
118
-
119
-
120
-
121
-
122
-
123
-
124
-
125
-
126
-
127
-
128
-
129
-
130
-
131
-
132
-
133
-
134
-
135
-
136
-
137
-
138
-
139
-
140
-
141
-
142
-
143
-
144
-
145
-
146
-
147
-
148
-
149
-
150
-
151
-
152
-
153
-
154
-
155
-
156
-
157
-
158
-
159
-
160
-
 161
161 -
 162
162 -
 163
163 -
 164
164 -
 165
165 -
 166
166 -
 167
167 -
 168
168 -
 169
169 -
 170
170 -
 171
171 -
 172
172 -
 173
173 -
 174
174 -
 175
175 -
 176
176 -
 177
177 -
 178
178 -
 179
179 -
 180
180 -
 181
181 -
182
-
183
-
184
-
185
-
186
-
187
-
188
-
189
-
190
-
191
-
192
-
193
-
194
-
195
-
196
-
197
-
198
-
199
-
200
-
201
-
202
-
203
-
204
-
205
-
206
-
207
-
208
-
209
-
210
-
211
-
212
-
213
-
214
-
215
-
216
-
217
-
218
-
219
-
220
-
221
-
222
-
223
-
224
-
225
-
226
-
227
-
228
 |
 |

TOYOTA MOTOR CORPORATION
NOTES TO CONSOLIDATED FINANCIAL STATEMENTS—(Continued)
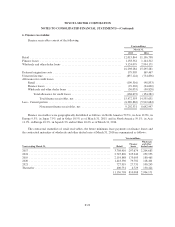
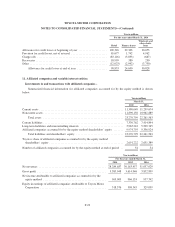
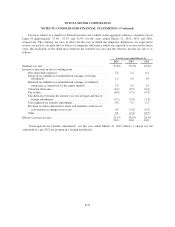
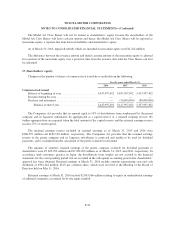
Entities comprising a significant portion of Toyota’s investment in affiliated companies and percentage of
ownership are presented below:
Percentage of ownership
March 31,
Name of affiliated companies 2015 2016
Denso Corporation ....................................................... 24.9% 24.9%
Toyota Industries Corporation .............................................. 24.6% 24.6%
Aisin Seiki Co., Ltd. ...................................................... 23.3% 23.3%
Toyota Tsusho Corporation ................................................. 22.0% 22.0%
Toyoda Gosei Co., Ltd. .................................................... 43.0% 43.0%
Certain affiliated companies accounted for by the equity method with carrying amounts of
¥2,010,249 million and ¥1,950,661 million at March 31, 2015 and 2016, respectively, were quoted on various
established markets at an aggregate value of ¥2,889,079 million and ¥2,470,588 million, respectively. Toyota
evaluated its investments in affiliated companies, considering the length of time and the extent to which the
quoted market prices have been less than the carrying amounts, the financial condition and near-term prospects
of the affiliated companies and Toyota’s ability and intent to retain those investments in the companies for a
period of time. Toyota did not recognize any impairment loss for the years ended March 31, 2014, 2015 and
2016.
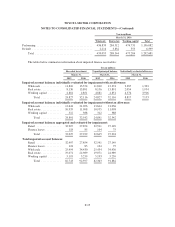
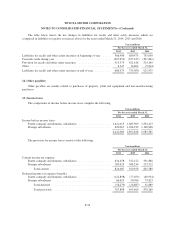
Account balances and transactions with affiliated companies are presented below:
Yen in millions
March 31,
2015 2016
Trade accounts and notes receivable, and other receivables ........................ 266,999 256,700
Accounts payable and other payables ......................................... 635,878 676,415
Yen in millions
For the years ended March 31,
2014 2015 2016
Net revenues .................................................. 1,854,708 1,785,238 1,804,493
Purchases ..................................................... 4,289,583 5,065,613 4,359,854
Dividends from affiliated companies accounted for by the equity method for the years ended March 31,
2014, 2015 and 2016 were ¥147,039 million, ¥174,485 million and ¥186,212 million, respectively.
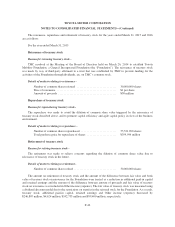
Toyota does not have any significant related party transactions other than transactions with affiliated
companies in the ordinary course of business.
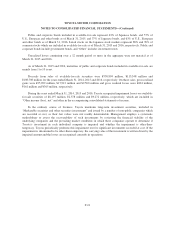
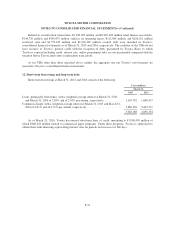
Variable Interest Entities -
Toyota enters into securitization transactions using special-purpose entities, that are considered variable
interest entities (“VIEs”). Although the finance receivables and vehicles on operating leases related to
securitization transactions have been legally sold to the VIEs, Toyota has both the power to direct the activities
of the VIEs that most significantly impact the VIEs’ economic performance and the obligation to absorb losses of
the VIEs or the right to receive benefits from the VIEs that could potentially be significant to the VIEs. As a
result, Toyota is considered the primary beneficiary of the VIEs and therefore consolidates the VIEs.
F-30