Toyota 2015 Annual Report Download - page 144
Download and view the complete annual report
Please find page 144 of the 2015 Toyota annual report below. You can navigate through the pages in the report by either clicking on the pages listed below, or by using the keyword search tool below to find specific information within the annual report.-
 1
1 -
2
-
3
-
4
-
5
-
6
-
7
-
8
-
9
-
10
-
11
-
12
-
13
-
14
-
15
-
16
-
17
-
18
-
19
-
20
-
21
-
22
-
23
-
24
-
25
-
26
-
27
-
28
-
29
-
30
-
31
-
32
-
33
-
34
-
35
-
36
-
37
-
38
-
39
-
40
-
41
-
42
-
43
-
44
-
45
-
46
-
47
-
48
-
49
-
50
-
51
-
52
-
53
-
54
-
55
-
56
-
57
-
58
-
59
-
60
-
61
-
62
-
63
-
64
-
65
-
66
-
67
-
68
-
69
-
70
-
71
-
72
-
73
-
74
-
75
-
76
-
77
-
78
-
79
-
80
-
81
-
82
-
83
-
84
-
85
-
86
-
87
-
88
-
89
-
90
-
91
-
92
-
93
-
94
-
95
-
96
-
97
-
98
-
99
-
100
-
101
-
102
-
103
-
104
-
105
-
106
-
107
-
108
-
109
-
110
-
111
-
112
-
113
-
114
-
115
-
116
-
117
-
118
-
119
-
120
-
121
-
122
-
123
-
124
-
125
-
126
-
127
-
128
-
129
-
130
-
131
-
132
-
133
-
 134
134 -
 135
135 -
 136
136 -
 137
137 -
 138
138 -
 139
139 -
 140
140 -
 141
141 -
 142
142 -
 143
143 -
 144
144 -
 145
145 -
 146
146 -
 147
147 -
 148
148 -
 149
149 -
 150
150 -
 151
151 -
 152
152 -
 153
153 -
 154
154 -
155
-
156
-
157
-
158
-
159
-
160
-
161
-
162
-
163
-
164
-
165
-
166
-
167
-
168
-
169
-
170
-
171
-
172
-
173
-
174
-
175
-
176
-
177
-
178
-
179
-
180
-
181
-
182
-
183
-
184
-
185
-
186
-
187
-
188
-
189
-
190
-
191
-
192
-
193
-
194
-
195
-
196
-
197
-
198
-
199
-
200
-
201
-
202
-
203
-
204
-
205
-
206
-
207
-
208
-
209
-
210
-
211
-
212
-
213
-
214
-
215
-
216
-
217
-
218
-
219
-
220
-
221
-
222
-
223
-
224
-
225
-
226
-
227
-
228
 |
 |

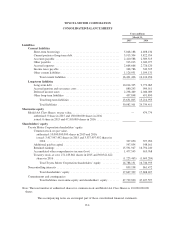
TOYOTA MOTOR CORPORATION
CONSOLIDATED BALANCE SHEETS
Yen in millions
March 31,
2015 2016
Assets
Current assets
Cash and cash equivalents ...................................... 2,284,557 2,939,428
Time deposits ................................................ 149,321 1,032,034
Marketable securities .......................................... 2,782,099 1,511,389
Trade accounts and notes receivable, less allowance for doubtful accounts
of ¥40,849 million in 2015 and ¥83,969 million in 2016 ............. 2,108,660 2,000,149
Finance receivables, net ........................................ 6,269,862 5,912,684
Other receivables ............................................. 420,708 451,406
Inventories .................................................. 2,137,618 2,061,511
Deferred income taxes ......................................... 978,179 967,607
Prepaid expenses and other current assets .......................... 805,393 1,333,345
Total current assets ........................................ 17,936,397 18,209,553
Noncurrent finance receivables, net ................................. 9,202,531 8,642,947
Investments and other assets
Marketable securities and other securities investments ................ 7,632,126 7,439,799
Affiliated companies .......................................... 2,691,460 2,631,612
Employees receivables ......................................... 45,206 32,998
Other ....................................................... 926,391 730,271
Total investments and other assets ............................ 11,295,183 10,834,680
Property, plant and equipment
Land ....................................................... 1,354,815 1,352,904
Buildings .................................................... 4,282,839 4,311,895
Machinery and equipment ...................................... 10,945,377 10,945,267
Vehicles and equipment on operating leases ........................ 5,199,986 5,652,622
Construction in progress ........................................ 581,412 513,953
Total property, plant and equipment, at cost .................... 22,364,429 22,776,641
Less - Accumulated depreciation ................................. (13,068,710) (13,036,224)
Total property, plant and equipment, net ....................... 9,295,719 9,740,417
Total assets .............................................. 47,729,830 47,427,597
The accompanying notes are an integral part of these consolidated financial statements.
F-3