Toyota 2015 Annual Report Download - page 210
Download and view the complete annual report
Please find page 210 of the 2015 Toyota annual report below. You can navigate through the pages in the report by either clicking on the pages listed below, or by using the keyword search tool below to find specific information within the annual report.-
 1
1 -
2
-
3
-
4
-
5
-
6
-
7
-
8
-
9
-
10
-
11
-
12
-
13
-
14
-
15
-
16
-
17
-
18
-
19
-
20
-
21
-
22
-
23
-
24
-
25
-
26
-
27
-
28
-
29
-
30
-
31
-
32
-
33
-
34
-
35
-
36
-
37
-
38
-
39
-
40
-
41
-
42
-
43
-
44
-
45
-
46
-
47
-
48
-
49
-
50
-
51
-
52
-
53
-
54
-
55
-
56
-
57
-
58
-
59
-
60
-
61
-
62
-
63
-
64
-
65
-
66
-
67
-
68
-
69
-
70
-
71
-
72
-
73
-
74
-
75
-
76
-
77
-
78
-
79
-
80
-
81
-
82
-
83
-
84
-
85
-
86
-
87
-
88
-
89
-
90
-
91
-
92
-
93
-
94
-
95
-
96
-
97
-
98
-
99
-
100
-
101
-
102
-
103
-
104
-
105
-
106
-
107
-
108
-
109
-
110
-
111
-
112
-
113
-
114
-
115
-
116
-
117
-
118
-
119
-
120
-
121
-
122
-
123
-
124
-
125
-
126
-
127
-
128
-
129
-
130
-
131
-
132
-
133
-
134
-
135
-
136
-
137
-
138
-
139
-
140
-
141
-
142
-
143
-
144
-
145
-
146
-
147
-
148
-
149
-
150
-
151
-
152
-
153
-
154
-
155
-
156
-
157
-
158
-
159
-
160
-
161
-
162
-
163
-
164
-
165
-
166
-
167
-
168
-
169
-
170
-
171
-
172
-
173
-
174
-
175
-
176
-
177
-
178
-
179
-
180
-
181
-
182
-
183
-
184
-
185
-
186
-
187
-
188
-
189
-
190
-
191
-
192
-
193
-
194
-
195
-
196
-
197
-
198
-
199
-
 200
200 -
 201
201 -
 202
202 -
 203
203 -
 204
204 -
 205
205 -
 206
206 -
 207
207 -
 208
208 -
 209
209 -
 210
210 -
 211
211 -
 212
212 -
 213
213 -
 214
214 -
 215
215 -
 216
216 -
 217
217 -
 218
218 -
 219
219 -
 220
220 -
221
-
222
-
223
-
224
-
225
-
226
-
227
-
228
 |
 |

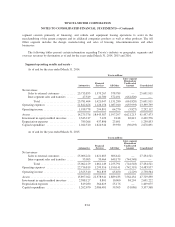
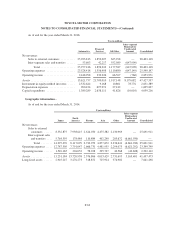
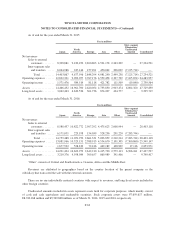
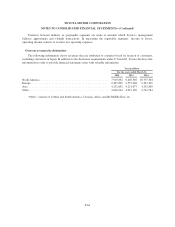
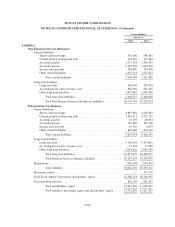
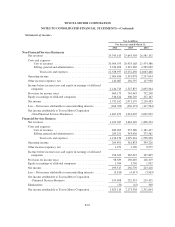
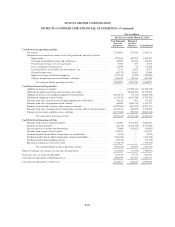
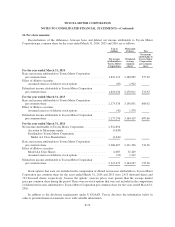
TOYOTA MOTOR CORPORATION
NOTES TO CONSOLIDATED FINANCIAL STATEMENTS—(Continued)
Yen in millions
For the year ended March 31, 2016
Non-Financial
Services
Businesses
Financial
Services
Business Consolidated
Cash flows from operating activities
Net income .............................................................. 2,210,483 223,418 2,434,211
Adjustments to reconcile net income to net cash provided by operating activities
Depreciation ......................................................... 927,846 697,991 1,625,837
Provision for doubtful accounts and credit losses ............................ 69,029 90,236 159,265
Pension and severance costs, less payments ................................ 8,300 533 8,833
Losses on disposal of fixed assets ........................................ 33,293 36 33,329
Unrealized losses on available-for-sale securities, net ......................... 3,217 6,055 9,272
Deferred income taxes ................................................. (43,237) 76,423 32,889
Equity in earnings of affiliated companies .................................. (327,167) (1,932) (329,099)
Changes in operating assets and liabilities, and other ......................... 386,529 148,376 486,320
Net cash provided by operating activities .............................. 3,268,293 1,241,136 4,460,857
Cash flows from investing activities
Additions to finance receivables ............................................. — (23,399,113) (13,549,278)
Collection of and proceeds from sales of finance receivables ....................... — 22,918,132 13,115,854
Additions to fixed assets excluding equipment leased to others ..................... (1,265,174) (17,371) (1,282,545)
Additions to equipment leased to others ....................................... (155,931) (2,620,740) (2,776,671)
Proceeds from sales of fixed assets excluding equipment leased to others ............. 41,154 993 42,147
Proceeds from sales of equipment leased to others ............................... 60,989 1,050,738 1,111,727
Purchases of marketable securities and security investments ....................... (1,302,965) (894,512) (2,197,477)
Proceeds from sales of and maturity of marketable securities and security investments . . . 2,471,876 943,939 3,415,815
Changes in investments and other assets, and other ............................... (1,371,368) 296,788 (1,062,116)
Net cash used in investing activities ................................... (1,521,419) (1,721,146) (3,182,544)
Cash flows from financing activities
Proceeds from issuance of long-term debt ...................................... 110,691 4,815,323 4,845,872
Payments of long-term debt ................................................. (71,758) (4,127,178) (4,176,202)
Increase (decrease) in short-term borrowings ................................... 75,990 (132,852) (10,903)
Proceeds from issuance of class shares ........................................ 474,917 — 474,917
Dividends paid to Toyota Motor Corporation class shareholders .................... (1,225) — (1,225)
Dividends paid to Toyota Motor Corporation common shareholders ................. (704,728) — (704,728)
Dividends paid to noncontrolling interests ...................................... (73,129) — (73,129)
Reissuance (repurchase) of treasury stock ...................................... (778,173) — (778,173)
Net cash provided by (used in) financing activities ....................... (967,415) 555,293 (423,571)
Effect of exchange rate changes on cash and cash equivalents .......................... (142,301) (57,570) (199,871)
Net increase in cash and cash equivalents .......................................... 637,158 17,713 654,871
Cash and cash equivalents at beginning of year ...................................... 1,680,994 603,563 2,284,557
Cash and cash equivalents at end of year ........................................... 2,318,152 621,276 2,939,428
F-69