Toyota 2015 Annual Report Download - page 6
Download and view the complete annual report
Please find page 6 of the 2015 Toyota annual report below. You can navigate through the pages in the report by either clicking on the pages listed below, or by using the keyword search tool below to find specific information within the annual report.-
 1
1 -
 2
2 -
 3
3 -
 4
4 -
 5
5 -
 6
6 -
 7
7 -
 8
8 -
 9
9 -
 10
10 -
 11
11 -
 12
12 -
 13
13 -
 14
14 -
 15
15 -
 16
16 -
 17
17 -
18
-
19
-
20
-
21
-
22
-
23
-
24
-
25
-
26
-
27
-
28
-
29
-
30
-
31
-
32
-
33
-
34
-
35
-
36
-
37
-
38
-
39
-
40
-
41
-
42
-
43
-
44
-
45
-
46
-
47
-
48
-
49
-
50
-
51
-
52
-
53
-
54
-
55
-
56
-
57
-
58
-
59
-
60
-
61
-
62
-
63
-
64
-
65
-
66
-
67
-
68
-
69
-
70
-
71
-
72
-
73
-
74
-
75
-
76
-
77
-
78
-
79
-
80
-
81
-
82
-
83
-
84
-
85
-
86
-
87
-
88
-
89
-
90
-
91
-
92
-
93
-
94
-
95
-
96
-
97
-
98
-
99
-
100
-
101
-
102
-
103
-
104
-
105
-
106
-
107
-
108
-
109
-
110
-
111
-
112
-
113
-
114
-
115
-
116
-
117
-
118
-
119
-
120
-
121
-
122
-
123
-
124
-
125
-
126
-
127
-
128
-
129
-
130
-
131
-
132
-
133
-
134
-
135
-
136
-
137
-
138
-
139
-
140
-
141
-
142
-
143
-
144
-
145
-
146
-
147
-
148
-
149
-
150
-
151
-
152
-
153
-
154
-
155
-
156
-
157
-
158
-
159
-
160
-
161
-
162
-
163
-
164
-
165
-
166
-
167
-
168
-
169
-
170
-
171
-
172
-
173
-
174
-
175
-
176
-
177
-
178
-
179
-
180
-
181
-
182
-
183
-
184
-
185
-
186
-
187
-
188
-
189
-
190
-
191
-
192
-
193
-
194
-
195
-
196
-
197
-
198
-
199
-
200
-
201
-
202
-
203
-
204
-
205
-
206
-
207
-
208
-
209
-
210
-
211
-
212
-
213
-
214
-
215
-
216
-
217
-
218
-
219
-
220
-
221
-
222
-
223
-
224
-
225
-
226
-
227
-
228
 |
 |

PART I
ITEM 1. IDENTITY OF DIRECTORS, SENIOR MANAGEMENT AND ADVISERS
Not applicable.
ITEM 2. OFFER STATISTICS AND EXPECTED TIMETABLE
Not applicable.
ITEM 3. KEY INFORMATION
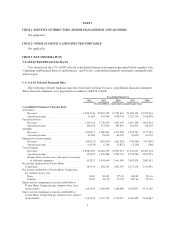
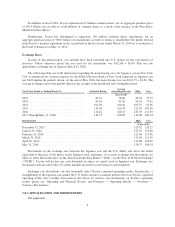
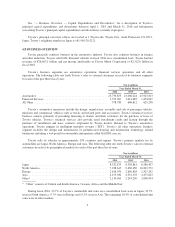
3.A SELECTED FINANCIAL DATA
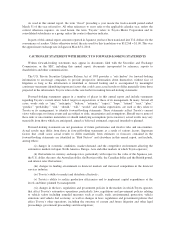
You should read the U.S. GAAP selected consolidated financial information presented below together with
“Operating and Financial Review and Prospects” and Toyota’s consolidated financial statements contained in this
annual report.
U.S. GAAP Selected Financial Data
The following selected financial data have been derived from Toyota’s consolidated financial statements.
These financial statements were prepared in accordance with U.S. GAAP.
Year Ended March 31,
2012 2013 2014 2015 2016
(Yen in millions, except share and per share data)
Consolidated Statement of Income Data:
Automotive:
Revenues ................................. 16,994,546 20,419,100 23,781,404 25,062,129 25,977,416
Operating income .......................... 21,683 944,704 1,938,778 2,325,310 2,448,998
Financial Services:
Revenues ................................. 1,100,324 1,170,670 1,421,047 1,661,149 1,896,224
Operating income .......................... 306,438 315,820 294,891 361,833 339,226
All Other:
Revenues ................................. 1,048,915 1,066,461 1,151,280 1,255,791 1,177,387
Operating income .......................... 42,062 53,616 64,270 65,650 66,507
Elimination of intersegment:
Revenues ................................. (560,132) (592,039) (661,820) (744,548) (647,909)
Operating income .......................... (14,556) 6,748 (5,827) (2,229) (760)
Total Company:
Revenues ................................. 18,583,653 22,064,192 25,691,911 27,234,521 28,403,118
Operating income .......................... 355,627 1,320,888 2,292,112 2,750,564 2,853,971
Income before income taxes and equity in earnings
of affiliated companies .................... 432,873 1,403,649 2,441,080 2,892,828 2,983,381
Net income attributable to Toyota Motor
Corporation ................................. 283,559 962,163 1,823,119 2,173,338 2,312,694
Net income attributable to Toyota Motor Corporation
per common share (yen):
Basic .................................... 90.21 303.82 575.30 688.02 741.36
Diluted ................................... 90.20 303.78 574.92 687.66 735.36
Shares used in computing net income attributable to
Toyota Motor Corporation per common share, basic
(in thousands) ............................... 3,143,470 3,166,909 3,168,989 3,158,851 3,111,306
Shares used in computing net income attributable to
Toyota Motor Corporation per common share, diluted
(in thousands) ............................... 3,143,470 3,167,155 3,170,911 3,160,429 3,144,947
1