Toyota 2015 Annual Report Download - page 70
Download and view the complete annual report
Please find page 70 of the 2015 Toyota annual report below. You can navigate through the pages in the report by either clicking on the pages listed below, or by using the keyword search tool below to find specific information within the annual report.-
 1
1 -
2
-
3
-
4
-
5
-
6
-
7
-
8
-
9
-
10
-
11
-
12
-
13
-
14
-
15
-
16
-
17
-
18
-
19
-
20
-
21
-
22
-
23
-
24
-
25
-
26
-
27
-
28
-
29
-
30
-
31
-
32
-
33
-
34
-
35
-
36
-
37
-
38
-
39
-
40
-
41
-
42
-
43
-
44
-
45
-
46
-
47
-
48
-
49
-
50
-
51
-
52
-
53
-
54
-
55
-
56
-
57
-
58
-
59
-
 60
60 -
 61
61 -
 62
62 -
 63
63 -
 64
64 -
 65
65 -
 66
66 -
 67
67 -
 68
68 -
 69
69 -
 70
70 -
 71
71 -
 72
72 -
 73
73 -
 74
74 -
 75
75 -
 76
76 -
 77
77 -
 78
78 -
 79
79 -
 80
80 -
81
-
82
-
83
-
84
-
85
-
86
-
87
-
88
-
89
-
90
-
91
-
92
-
93
-
94
-
95
-
96
-
97
-
98
-
99
-
100
-
101
-
102
-
103
-
104
-
105
-
106
-
107
-
108
-
109
-
110
-
111
-
112
-
113
-
114
-
115
-
116
-
117
-
118
-
119
-
120
-
121
-
122
-
123
-
124
-
125
-
126
-
127
-
128
-
129
-
130
-
131
-
132
-
133
-
134
-
135
-
136
-
137
-
138
-
139
-
140
-
141
-
142
-
143
-
144
-
145
-
146
-
147
-
148
-
149
-
150
-
151
-
152
-
153
-
154
-
155
-
156
-
157
-
158
-
159
-
160
-
161
-
162
-
163
-
164
-
165
-
166
-
167
-
168
-
169
-
170
-
171
-
172
-
173
-
174
-
175
-
176
-
177
-
178
-
179
-
180
-
181
-
182
-
183
-
184
-
185
-
186
-
187
-
188
-
189
-
190
-
191
-
192
-
193
-
194
-
195
-
196
-
197
-
198
-
199
-
200
-
201
-
202
-
203
-
204
-
205
-
206
-
207
-
208
-
209
-
210
-
211
-
212
-
213
-
214
-
215
-
216
-
217
-
218
-
219
-
220
-
221
-
222
-
223
-
224
-
225
-
226
-
227
-
228
 |
 |

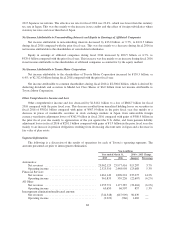
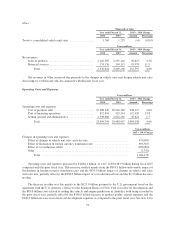
Cost Reduction Efforts
During fiscal 2016, continued cost reduction efforts together with suppliers contributed to a reduction of
operating costs and expenses by ¥390.0 billion. This was due to ¥340.0 billion in cost reduction efforts
concerning design related costs due mainly to ongoing value engineering activities, and ¥50.0 billion in cost
reduction efforts at plants and logistics departments.
These cost reduction efforts related to ongoing value engineering and value analysis activities, the use of
common parts resulting in a reduction of part types and other manufacturing initiatives designed to reduce the
costs of vehicle production. The amount of the effect of cost reduction efforts includes the impact of fluctuation
in the price of steel, precious metals, non-ferrous alloys including aluminum, plastic parts and other production
materials and parts.
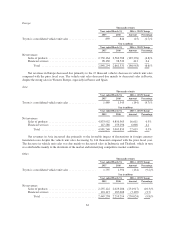
Cost of Products Sold
Cost of products sold increased by ¥539.7 billion, or 2.6%, to ¥21,456.0 billion during fiscal 2016 compared
with the prior fiscal year. The increase resulted mainly from the ¥450.0 billion impact of changes in vehicle unit
sales and sales mix, the ¥252.2 billion unfavorable impact of fluctuations in foreign currency translation rates,
the ¥60.0 billion increase in labor costs and the ¥50.0 billion increase in research and development expenses,
partially offset by the ¥390.0 billion impact of cost reduction efforts.
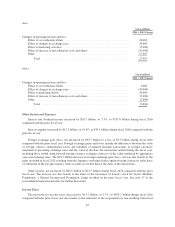
Cost of Financing Operations
Cost of financing operations increased by ¥224.0 billion, or 24.2%, to ¥1,149.3 billion during fiscal 2016
compared with the prior fiscal year. The increase resulted mainly from the increase in depreciation expenses,
which was mostly attributable to an increase in operating leases.
Selling, General and Administrative Expenses
Selling, general and administrative expenses increased by ¥301.4 billion, or 11.4%, to ¥2,943.6 billion
during fiscal 2016 compared with the prior fiscal year. This increase mainly reflected the ¥60.0 billion impact of
changes in vehicle unit sales and sales mix, the ¥53.8 billion increase in advertising costs, the ¥50.0 billion
increase in labor costs, the ¥35.4 billion unfavorable impact of fluctuations in foreign currency translation rates
and the increase in other various costs.
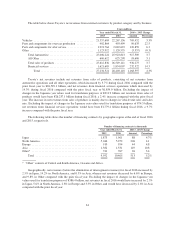
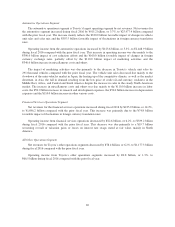
Operating Income
Yen in millions
2016 v. 2015 Change
Changes in operating income and loss:
Effect of cost reduction efforts .............................................. 390,000
Effect of changes in exchange rates .......................................... 160,000
Effect of marketing activities ............................................... (120,000)
Effect of increase of miscellaneous costs and others ............................. (340,000)
Other .................................................................. 13,407
Total .............................................................. 103,407
Toyota’s operating income increased by ¥103.4 billion, or 3.8%, to ¥2,853.9 billion during fiscal 2016
compared with the prior fiscal year. This increase was due mainly to the ¥390.0 billion impact of cost reduction
efforts and the ¥160.0 billion favorable impact of changes in foreign currency exchange rates, partially offset by
the ¥120.0 billion impact of marketing activities, and the ¥340.0 billion increase in miscellaneous costs and
65