Toyota 2015 Annual Report Download - page 130
Download and view the complete annual report
Please find page 130 of the 2015 Toyota annual report below. You can navigate through the pages in the report by either clicking on the pages listed below, or by using the keyword search tool below to find specific information within the annual report.-
 1
1 -
2
-
3
-
4
-
5
-
6
-
7
-
8
-
9
-
10
-
11
-
12
-
13
-
14
-
15
-
16
-
17
-
18
-
19
-
20
-
21
-
22
-
23
-
24
-
25
-
26
-
27
-
28
-
29
-
30
-
31
-
32
-
33
-
34
-
35
-
36
-
37
-
38
-
39
-
40
-
41
-
42
-
43
-
44
-
45
-
46
-
47
-
48
-
49
-
50
-
51
-
52
-
53
-
54
-
55
-
56
-
57
-
58
-
59
-
60
-
61
-
62
-
63
-
64
-
65
-
66
-
67
-
68
-
69
-
70
-
71
-
72
-
73
-
74
-
75
-
76
-
77
-
78
-
79
-
80
-
81
-
82
-
83
-
84
-
85
-
86
-
87
-
88
-
89
-
90
-
91
-
92
-
93
-
94
-
95
-
96
-
97
-
98
-
99
-
100
-
101
-
102
-
103
-
104
-
105
-
106
-
107
-
108
-
109
-
110
-
111
-
112
-
113
-
114
-
115
-
116
-
117
-
118
-
119
-
 120
120 -
 121
121 -
 122
122 -
 123
123 -
 124
124 -
 125
125 -
 126
126 -
 127
127 -
 128
128 -
 129
129 -
 130
130 -
 131
131 -
 132
132 -
 133
133 -
 134
134 -
 135
135 -
 136
136 -
 137
137 -
 138
138 -
 139
139 -
 140
140 -
141
-
142
-
143
-
144
-
145
-
146
-
147
-
148
-
149
-
150
-
151
-
152
-
153
-
154
-
155
-
156
-
157
-
158
-
159
-
160
-
161
-
162
-
163
-
164
-
165
-
166
-
167
-
168
-
169
-
170
-
171
-
172
-
173
-
174
-
175
-
176
-
177
-
178
-
179
-
180
-
181
-
182
-
183
-
184
-
185
-
186
-
187
-
188
-
189
-
190
-
191
-
192
-
193
-
194
-
195
-
196
-
197
-
198
-
199
-
200
-
201
-
202
-
203
-
204
-
205
-
206
-
207
-
208
-
209
-
210
-
211
-
212
-
213
-
214
-
215
-
216
-
217
-
218
-
219
-
220
-
221
-
222
-
223
-
224
-
225
-
226
-
227
-
228
 |
 |
foreign currency exchange contracts, foreign currency options, interest rate swaps, interest rate currency swap
agreements and interest rate options. Anticipated transactions denominated in foreign currencies that are covered
by Toyota’s derivative hedging are not included in the market risk analysis. Although operating leases are not
required to be included, Toyota has included these instruments in determining interest rate risk.
Foreign Currency Exchange Rate Risk
Toyota has foreign currency exposures related to buying, selling and financing in currencies other than the
local currencies in which it operates. Toyota is exposed to foreign currency risk related to future earnings or
assets and liabilities that are exposed due to operating cash flows and various financial instruments that are
denominated in foreign currencies. Toyota’s most significant foreign currency exposures relate to the U.S. dollar
and the euro.
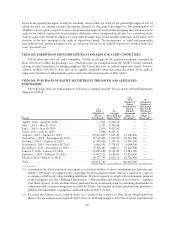
Toyota uses a value-at-risk analysis (“VAR”) to evaluate its exposure to changes in foreign currency
exchange rates. The VAR of the combined foreign exchange position represents a potential loss in pre-tax
earnings that was estimated to be ¥163.4 billion and ¥155.1 billion as of March 31, 2015 and 2016, respectively.
Based on Toyota’s overall currency exposure (including derivative positions), the risk during fiscal 2016 to
pre-tax cash flow from currency movements was on average ¥164.7 billion, with a high of ¥172.2 billion and a
low of ¥155.1 billion.
The VAR was estimated by using a Monte Carlo Simulation Method and assumed 95% confidence level on
the realization date and a 10-day holding period.
Interest Rate Risk
Toyota is subject to market risk from exposures to changes in interest rates based on its financing, investing
and cash management activities. Toyota enters into various financial instrument transactions to maintain the
desired level of exposure to the risk of interest rate fluctuations and to minimize interest expense. The potential
decrease in fair value resulting from a hypothetical 100 basis point upward shift in interest rates would be
approximately ¥244.9 billion as of March 31, 2015 and ¥231.2 billion as of March 31, 2016.
There are certain shortcomings inherent to the sensitivity analyses presented. The model assumes that
interest rate changes are instantaneous parallel shifts in the yield curve. However, in reality, changes are rarely
instantaneous. Although certain assets and liabilities may have similar maturities or periods to repricing, they
may not react correspondingly to changes in market interest rates. Also, the interest rates on certain types of
assets and liabilities may fluctuate with changes in market interest rates, while interest rates on other types of
assets may lag behind changes in market rates. Finance receivables are less susceptible to prepayments when
interest rates change and, as a result, Toyota’s model does not address prepayment risk for automotive related
finance receivables. However, in the event of a change in interest rates, actual loan prepayments may deviate
significantly from the assumptions used in the model.
Commodity Price Risk
Commodity price risk is the possibility of higher or lower costs due to changes in the prices of commodities,
such as non-ferrous alloys (e.g., aluminum), precious metals (e.g., palladium, platinum and rhodium) and ferrous
alloys, which Toyota uses in the production of motor vehicles. Toyota does not use derivative instruments to
hedge the price risk associated with the purchase of those commodities and controls its commodity price risk by
holding minimum stock levels.
Equity Price Risk
Toyota holds investments in various available-for-sale equity securities that are subject to price risk. The
fair value of available-for-sale equity securities was ¥2,704.8 billion as of March 31, 2015 and ¥2,558.9 billion as
125