Toyota 2015 Annual Report Download - page 189
Download and view the complete annual report
Please find page 189 of the 2015 Toyota annual report below. You can navigate through the pages in the report by either clicking on the pages listed below, or by using the keyword search tool below to find specific information within the annual report.-
 1
1 -
2
-
3
-
4
-
5
-
6
-
7
-
8
-
9
-
10
-
11
-
12
-
13
-
14
-
15
-
16
-
17
-
18
-
19
-
20
-
21
-
22
-
23
-
24
-
25
-
26
-
27
-
28
-
29
-
30
-
31
-
32
-
33
-
34
-
35
-
36
-
37
-
38
-
39
-
40
-
41
-
42
-
43
-
44
-
45
-
46
-
47
-
48
-
49
-
50
-
51
-
52
-
53
-
54
-
55
-
56
-
57
-
58
-
59
-
60
-
61
-
62
-
63
-
64
-
65
-
66
-
67
-
68
-
69
-
70
-
71
-
72
-
73
-
74
-
75
-
76
-
77
-
78
-
79
-
80
-
81
-
82
-
83
-
84
-
85
-
86
-
87
-
88
-
89
-
90
-
91
-
92
-
93
-
94
-
95
-
96
-
97
-
98
-
99
-
100
-
101
-
102
-
103
-
104
-
105
-
106
-
107
-
108
-
109
-
110
-
111
-
112
-
113
-
114
-
115
-
116
-
117
-
118
-
119
-
120
-
121
-
122
-
123
-
124
-
125
-
126
-
127
-
128
-
129
-
130
-
131
-
132
-
133
-
134
-
135
-
136
-
137
-
138
-
139
-
140
-
141
-
142
-
143
-
144
-
145
-
146
-
147
-
148
-
149
-
150
-
151
-
152
-
153
-
154
-
155
-
156
-
157
-
158
-
159
-
160
-
161
-
162
-
163
-
164
-
165
-
166
-
167
-
168
-
169
-
170
-
171
-
172
-
173
-
174
-
175
-
176
-
177
-
178
-
 179
179 -
 180
180 -
 181
181 -
 182
182 -
 183
183 -
 184
184 -
 185
185 -
 186
186 -
 187
187 -
 188
188 -
 189
189 -
 190
190 -
 191
191 -
 192
192 -
 193
193 -
 194
194 -
 195
195 -
 196
196 -
 197
197 -
 198
198 -
 199
199 -
200
-
201
-
202
-
203
-
204
-
205
-
206
-
207
-
208
-
209
-
210
-
211
-
212
-
213
-
214
-
215
-
216
-
217
-
218
-
219
-
220
-
221
-
222
-
223
-
224
-
225
-
226
-
227
-
228
 |
 |

TOYOTA MOTOR CORPORATION
NOTES TO CONSOLIDATED FINANCIAL STATEMENTS—(Continued)
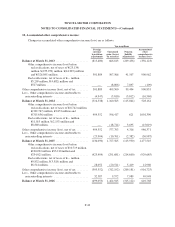
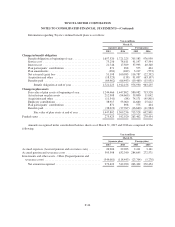
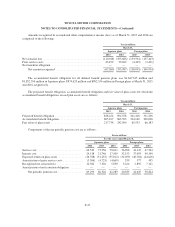
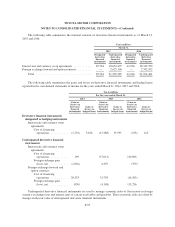
Other changes in plan assets and benefit obligations recognized in other comprehensive income (loss) are as
follows:
Yen in millions
For the years ended March 31,
Japanese plans Foreign plans
2014 2015 2016 2014 2015 2016
Net actuarial gain (loss) ...................... 71,890 130,455 (290,664) 52,253 (97,772) (11,242)
Recognized net actuarial loss .................. 12,562 7,302 5,850 5,224 2,892 7,121
Prior service costs ........................... 427 381 489 (96) (3,217) 573
Amortization of prior service costs .............. (5,566) (4,723) (4,669) 359 377 435
Amortization of net transition obligation ......... — — — — — —
Other ..................................... — 46 76 (7,605) 7,564 272
Total recognized in other comprehensive
income (loss) ......................... 79,313 133,461 (288,918) 50,135 (90,156) (2,841)
“Other” includes the impact of consolidation and deconsolidation of certain entities due to changes in
ownership interest and currency translation adjustments during the years ended March 31, 2014, 2015 and 2016.
The estimated prior service costs and net actuarial loss that will be amortized from accumulated other
comprehensive income (loss) into net periodic pension cost during the year ending March 31, 2017 are
¥(4,600) million and ¥14,500 million in Japanese plans, ¥400 million and ¥6,400 million in Foreign plans,
respectively.
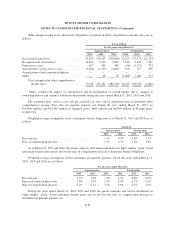
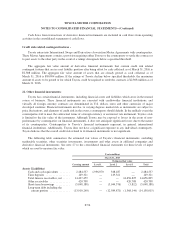
Weighted-average assumptions used to determine benefit obligations as of March 31, 2015 and 2016 are as
follows:
March 31,
Japanese plans Foreign plans
2015 2016 2015 2016
Discount rate .......................................... 1.1% 0.5% 4.0% 4.2%
Rate of compensation increase ............................ 2.5% 2.7% 4.4% 3.9%
As of March 31, 2015 and 2016, the parent company and certain subsidiaries in Japan employ “point” based
retirement benefit plans and do not use the rates of compensation increase to determine benefit obligations.
Weighted-average assumptions used to determine net periodic pension cost for the years ended March 31,
2014, 2015 and 2016 are as follows:
For the years ended March 31,
Japanese plans Foreign plans
2014 2015 2016 2014 2015 2016
Discount rate ...................... 1.7% 1.4% 1.1% 4.5% 4.8% 4.0%
Expected return on plan assets ......... 2.6% 2.5% 2.5% 6.9% 6.7% 6.3%
Rate of compensation increase ......... 2.2% 2.1% 2.5% 4.6% 4.5% 4.4%
During the years ended March 31, 2014, 2015 and 2016, the parent company and certain subsidiaries in
Japan employ “point” based retirement benefit plans and do not use the rates of compensation increase to
determine net periodic pension cost.
F-48