Toyota 2015 Annual Report Download - page 66
Download and view the complete annual report
Please find page 66 of the 2015 Toyota annual report below. You can navigate through the pages in the report by either clicking on the pages listed below, or by using the keyword search tool below to find specific information within the annual report.-
 1
1 -
2
-
3
-
4
-
5
-
6
-
7
-
8
-
9
-
10
-
11
-
12
-
13
-
14
-
15
-
16
-
17
-
18
-
19
-
20
-
21
-
22
-
23
-
24
-
25
-
26
-
27
-
28
-
29
-
30
-
31
-
32
-
33
-
34
-
35
-
36
-
37
-
38
-
39
-
40
-
41
-
42
-
43
-
44
-
45
-
46
-
47
-
48
-
49
-
50
-
51
-
52
-
53
-
54
-
55
-
 56
56 -
 57
57 -
 58
58 -
 59
59 -
 60
60 -
 61
61 -
 62
62 -
 63
63 -
 64
64 -
 65
65 -
 66
66 -
 67
67 -
 68
68 -
 69
69 -
 70
70 -
 71
71 -
 72
72 -
 73
73 -
 74
74 -
 75
75 -
 76
76 -
77
-
78
-
79
-
80
-
81
-
82
-
83
-
84
-
85
-
86
-
87
-
88
-
89
-
90
-
91
-
92
-
93
-
94
-
95
-
96
-
97
-
98
-
99
-
100
-
101
-
102
-
103
-
104
-
105
-
106
-
107
-
108
-
109
-
110
-
111
-
112
-
113
-
114
-
115
-
116
-
117
-
118
-
119
-
120
-
121
-
122
-
123
-
124
-
125
-
126
-
127
-
128
-
129
-
130
-
131
-
132
-
133
-
134
-
135
-
136
-
137
-
138
-
139
-
140
-
141
-
142
-
143
-
144
-
145
-
146
-
147
-
148
-
149
-
150
-
151
-
152
-
153
-
154
-
155
-
156
-
157
-
158
-
159
-
160
-
161
-
162
-
163
-
164
-
165
-
166
-
167
-
168
-
169
-
170
-
171
-
172
-
173
-
174
-
175
-
176
-
177
-
178
-
179
-
180
-
181
-
182
-
183
-
184
-
185
-
186
-
187
-
188
-
189
-
190
-
191
-
192
-
193
-
194
-
195
-
196
-
197
-
198
-
199
-
200
-
201
-
202
-
203
-
204
-
205
-
206
-
207
-
208
-
209
-
210
-
211
-
212
-
213
-
214
-
215
-
216
-
217
-
218
-
219
-
220
-
221
-
222
-
223
-
224
-
225
-
226
-
227
-
228
 |
 |

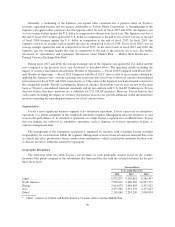
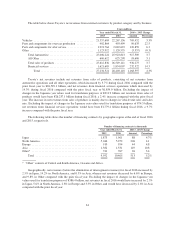
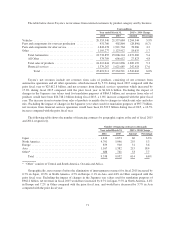
The table below shows Toyota’s net revenues from external customers by product category and by business.
Yen in millions
Year ended March 31, 2016 v. 2015 Change
2015 2016 Amount Percentage
Vehicles .......................................... 21,557,684 22,267,136 709,452 3.3%
Parts and components for overseas production ............ 402,864 493,499 90,635 22.5
Parts and components for after service .................. 1,921,764 2,042,623 120,859 6.3
Other ............................................. 1,123,912 1,120,555 (3,357) (0.3)
Total Automotive ............................... 25,006,224 25,923,813 917,589 3.7
All Other ...................................... 606,612 625,298 18,686 3.1
Total sales of products ........................... 25,612,836 26,549,111 936,275 3.7
Financial services ............................... 1,621,685 1,854,007 232,322 14.3
Total ..................................... 27,234,521 28,403,118 1,168,597 4.3%
Toyota’s net revenues include net revenues from sales of products, consisting of net revenues from
automotive operations and all other operations, which increased by 3.7% during fiscal 2016 compared with the
prior fiscal year to ¥26,549.1 billion, and net revenues from financial services operations which increased by
14.3% during fiscal 2016 compared with the prior fiscal year to ¥1,854.0 billion. Excluding the impact of
changes in the Japanese yen values used for translation purposes of ¥311.9 billion, net revenues from sales of
products would have been ¥26,237.1 billion during fiscal 2016, a 2.4% increase compared with the prior fiscal
year. The increase in net revenues from sales of products is mainly due to changes in vehicle unit sales and sales
mix. Excluding the impact of changes in the Japanese yen values used for translation purposes of ¥74.5 billion,
net revenues from financial services operations would have been ¥1,779.4 billion during fiscal 2016, a 9.7%
increase compared with the prior fiscal year.
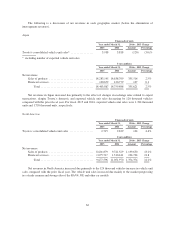
The following table shows the number of financing contracts by geographic region at the end of fiscal 2016
and 2015, respectively.
Number of financing contracts in thousands
Year ended March 31, 2016 v. 2015 Change
2015 2016 Amount Percentage
Japan .............................................. 1,873 1,961 88 4.7%
North America ....................................... 5,046 5,252 206 4.1
Europe ............................................. 910 954 44 4.8
Asia ............................................... 1,382 1,531 149 10.8
Other* ............................................. 741 767 26 3.4
Total .......................................... 9,952 10,465 513 5.2%
* “Other” consists of Central and South America, Oceania and Africa.
Geographically, net revenues (before the elimination of intersegment revenues) for fiscal 2016 increased by
2.5% in Japan, 14.2% in North America, and 0.5% in Asia, whereas net revenues decreased by 6.6% in Europe,
and 9.8% in Other compared with the prior fiscal year. Excluding the impact of changes in the Japanese yen
values used for translation purposes of ¥386.4 billion, net revenues in fiscal 2016 would have increased by 2.5%
in Japan, 5.6% in North America, 2.8% in Europe and 3.3% in Other, and would have decreased by 2.6% in Asia
compared with the prior fiscal year.
61