Toyota 2015 Annual Report Download - page 69
Download and view the complete annual report
Please find page 69 of the 2015 Toyota annual report below. You can navigate through the pages in the report by either clicking on the pages listed below, or by using the keyword search tool below to find specific information within the annual report.-
 1
1 -
2
-
3
-
4
-
5
-
6
-
7
-
8
-
9
-
10
-
11
-
12
-
13
-
14
-
15
-
16
-
17
-
18
-
19
-
20
-
21
-
22
-
23
-
24
-
25
-
26
-
27
-
28
-
29
-
30
-
31
-
32
-
33
-
34
-
35
-
36
-
37
-
38
-
39
-
40
-
41
-
42
-
43
-
44
-
45
-
46
-
47
-
48
-
49
-
50
-
51
-
52
-
53
-
54
-
55
-
56
-
57
-
58
-
 59
59 -
 60
60 -
 61
61 -
 62
62 -
 63
63 -
 64
64 -
 65
65 -
 66
66 -
 67
67 -
 68
68 -
 69
69 -
 70
70 -
 71
71 -
 72
72 -
 73
73 -
 74
74 -
 75
75 -
 76
76 -
 77
77 -
 78
78 -
 79
79 -
80
-
81
-
82
-
83
-
84
-
85
-
86
-
87
-
88
-
89
-
90
-
91
-
92
-
93
-
94
-
95
-
96
-
97
-
98
-
99
-
100
-
101
-
102
-
103
-
104
-
105
-
106
-
107
-
108
-
109
-
110
-
111
-
112
-
113
-
114
-
115
-
116
-
117
-
118
-
119
-
120
-
121
-
122
-
123
-
124
-
125
-
126
-
127
-
128
-
129
-
130
-
131
-
132
-
133
-
134
-
135
-
136
-
137
-
138
-
139
-
140
-
141
-
142
-
143
-
144
-
145
-
146
-
147
-
148
-
149
-
150
-
151
-
152
-
153
-
154
-
155
-
156
-
157
-
158
-
159
-
160
-
161
-
162
-
163
-
164
-
165
-
166
-
167
-
168
-
169
-
170
-
171
-
172
-
173
-
174
-
175
-
176
-
177
-
178
-
179
-
180
-
181
-
182
-
183
-
184
-
185
-
186
-
187
-
188
-
189
-
190
-
191
-
192
-
193
-
194
-
195
-
196
-
197
-
198
-
199
-
200
-
201
-
202
-
203
-
204
-
205
-
206
-
207
-
208
-
209
-
210
-
211
-
212
-
213
-
214
-
215
-
216
-
217
-
218
-
219
-
220
-
221
-
222
-
223
-
224
-
225
-
226
-
227
-
228
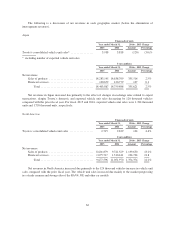
 |
 |

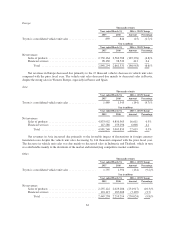
Net revenues in Other decreased due primarily to the 161 thousand vehicles decrease in vehicle unit sales
compared with the prior fiscal year. The decrease in vehicle unit sales was due mainly to decreased sales in the
Middle East, Africa and Central and South America.
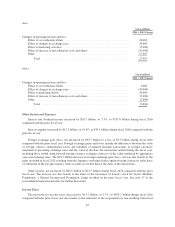
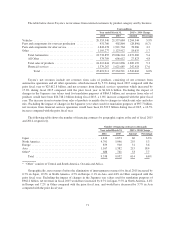
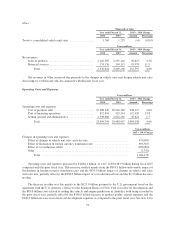
Operating Costs and Expenses
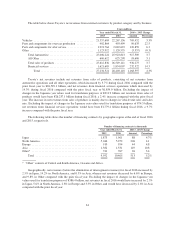
Yen in millions
Year ended March 31, 2016 v. 2015 Change
2015 2016 Amount Percentage
Operating costs and expenses
Cost of products sold ............................ 20,916,362 21,456,086 539,724 2.6%
Cost of financing operations ...................... 925,314 1,149,379 224,065 24.2
Selling, general and administrative ................. 2,642,281 2,943,682 301,401 11.4
Total ..................................... 24,483,957 25,549,147 1,065,190 4.4%
Yen in millions
2016 v. 2015 Change
Changes in operating costs and expenses:
Effect of changes in vehicle unit sales and sales mix ............................. 510,000
Effect of fluctuation in foreign currency translation rates ......................... 350,700
Effect of increase of cost of financing operations ................................ 161,000
Effect of cost reduction efforts .............................................. (390,000)
Effect of increase of miscellaneous costs and others ............................. 433,490
Total .............................................................. 1,065,190
Operating costs and expenses increased by ¥1,065.1 billion, or 4.4%, to ¥25,549.1 billion during fiscal 2016
compared with the prior fiscal year. This increase resulted from the ¥510.0 billion impact of changes in vehicle
unit sales and sales mix, ¥350.7 billion unfavorable impact of fluctuations in foreign currency translation rates,
¥161.0 billion increase in cost of financing operations (excluding the effect of fluctuation in foreign currency
translation rates) and the ¥433.4 billion increase of miscellaneous costs and others, partially offset by the ¥390.0
billion impact of cost reduction efforts.
The increase in miscellaneous costs and others was due mainly to the ¥110.0 billion increase in labor costs,
the ¥50.0 billion increase in research and development expenses, the ¥50.0 billion increase in depreciation
expenses and the ¥130.0 billion increase in other various costs, partially offset by the ¥62.8 billion decrease in
product quality related expenses.
The decrease in product quality related expenses was due mainly to the effect of the strengthening of the
Japanese yen against other currencies at the end of fiscal 2016 in comparison to the prior fiscal year end,
primarily concerning the translation of liabilities denominated in foreign currencies. See note 13 to the
consolidated financial statements for further discussion.
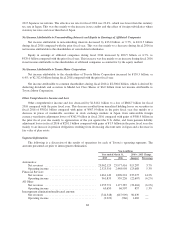
During fiscal 2016 and beyond, Toyota announced recalls and other safety measures including the
following:
In October 2015, Toyota announced in Japan and other regions recalls on certain Toyota vehicles in relation
to the power window master switch. In November 2015, Toyota announced in Japan and other regions recalls on
certain Toyota vehicles in relation to the clutch piston in the continuously variable transmission. In May, June,
August, September and November 2015 and in March, May and June 2016, Toyota announced in Japan and other
regions recalls on certain Toyota and Lexus vehicles in relation to the driver/front passenger airbag inflator.
64