Toyota 2015 Annual Report Download - page 75
Download and view the complete annual report
Please find page 75 of the 2015 Toyota annual report below. You can navigate through the pages in the report by either clicking on the pages listed below, or by using the keyword search tool below to find specific information within the annual report.-
 1
1 -
2
-
3
-
4
-
5
-
6
-
7
-
8
-
9
-
10
-
11
-
12
-
13
-
14
-
15
-
16
-
17
-
18
-
19
-
20
-
21
-
22
-
23
-
24
-
25
-
26
-
27
-
28
-
29
-
30
-
31
-
32
-
33
-
34
-
35
-
36
-
37
-
38
-
39
-
40
-
41
-
42
-
43
-
44
-
45
-
46
-
47
-
48
-
49
-
50
-
51
-
52
-
53
-
54
-
55
-
56
-
57
-
58
-
59
-
60
-
61
-
62
-
63
-
64
-
 65
65 -
 66
66 -
 67
67 -
 68
68 -
 69
69 -
 70
70 -
 71
71 -
 72
72 -
 73
73 -
 74
74 -
 75
75 -
 76
76 -
 77
77 -
 78
78 -
 79
79 -
 80
80 -
 81
81 -
 82
82 -
 83
83 -
 84
84 -
 85
85 -
86
-
87
-
88
-
89
-
90
-
91
-
92
-
93
-
94
-
95
-
96
-
97
-
98
-
99
-
100
-
101
-
102
-
103
-
104
-
105
-
106
-
107
-
108
-
109
-
110
-
111
-
112
-
113
-
114
-
115
-
116
-
117
-
118
-
119
-
120
-
121
-
122
-
123
-
124
-
125
-
126
-
127
-
128
-
129
-
130
-
131
-
132
-
133
-
134
-
135
-
136
-
137
-
138
-
139
-
140
-
141
-
142
-
143
-
144
-
145
-
146
-
147
-
148
-
149
-
150
-
151
-
152
-
153
-
154
-
155
-
156
-
157
-
158
-
159
-
160
-
161
-
162
-
163
-
164
-
165
-
166
-
167
-
168
-
169
-
170
-
171
-
172
-
173
-
174
-
175
-
176
-
177
-
178
-
179
-
180
-
181
-
182
-
183
-
184
-
185
-
186
-
187
-
188
-
189
-
190
-
191
-
192
-
193
-
194
-
195
-
196
-
197
-
198
-
199
-
200
-
201
-
202
-
203
-
204
-
205
-
206
-
207
-
208
-
209
-
210
-
211
-
212
-
213
-
214
-
215
-
216
-
217
-
218
-
219
-
220
-
221
-
222
-
223
-
224
-
225
-
226
-
227
-
228
 |
 |

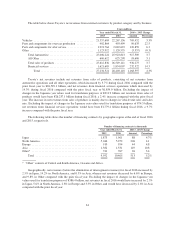
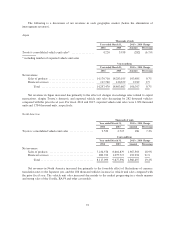
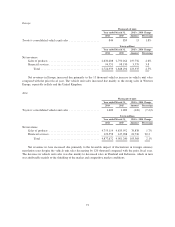
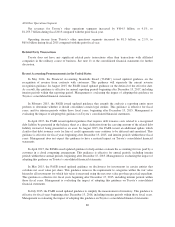
Results of Operations — Fiscal 2015 Compared with Fiscal 2014
Yen in millions
Year ended March 31, 2015 v. 2014 Change
2014 2015 Amount Percentage
Net revenues:
Japan ......................................... 14,297,470 14,403,867 106,397 0.7%
North America ................................. 8,117,099 9,677,596 1,560,497 19.2
Europe ....................................... 2,724,959 2,848,294 123,335 4.5
Asia ......................................... 4,877,672 4,981,240 103,568 2.1
Other* ........................................ 2,336,641 2,449,238 112,597 4.8
Intersegment elimination/unallocated amount ......... (6,661,930) (7,125,714) (463,784) —
Total ..................................... 25,691,911 27,234,521 1,542,610 6.0
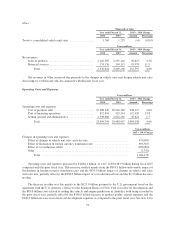
Operating income:
Japan ......................................... 1,510,165 1,571,476 61,311 4.1
North America ................................. 326,052 584,519 258,467 79.3
Europe ....................................... 58,228 81,118 22,890 39.3
Asia ......................................... 395,737 421,782 26,045 6.6
Other* ........................................ 42,568 111,509 68,941 162.0
Intersegment elimination/unallocated amount ......... (40,638) (19,840) 20,798 —
Total ..................................... 2,292,112 2,750,564 458,452 20.0
Operating margin ................................... 8.9% 10.1% 1.2%
Income before income taxes and equity in earnings of
affiliated companies ............................... 2,441,080 2,892,828 451,748 18.5
Net margin from income before income taxes and equity in
earnings of affiliated companies ..................... 9.5% 10.6% 1.1%
Equity in earnings of affiliated companies ............... 318,376 308,545 (9,831) (3.1)
Net income attributable to Toyota Motor Corporation ...... 1,823,119 2,173,338 350,219 19.2
Net margin attributable to Toyota Motor Corporation ....... 7.1% 8.0% 0.9%
* “Other” consists of Central and South America, Oceania, Africa and the Middle East.
Net Revenues
Toyota had net revenues for fiscal 2015 of ¥27,234.5 billion, an increase of ¥1,542.6 billion, or 6.0%,
compared with the prior fiscal year. This increase mainly reflected the favorable impact of fluctuations in foreign
currency translation rates of ¥962.2 billion and changes in vehicle unit sales and sales mix of ¥360.0 billion.
Excluding the impact of changes in the Japanese yen values used for translation purposes of ¥962.2 billion, net
revenues would have been ¥26,272.2 billion during fiscal 2015, a 2.3% increase compared with the prior fiscal
year. The North America automotive market in calendar year 2014 increased by 5.8% compared with the prior
calendar year due to the market in the U.S. progressing in a steady manner. However the Japanese automotive
market in fiscal 2015 decreased by 8.9% compared with the prior fiscal year due to the market downturn
resulting from the consumption tax increase. Under these automotive market conditions, Toyota’s consolidated
vehicle unit sales decreased by 1.6% compared with the prior fiscal year to 8,972 thousand vehicles.
70