Toyota 2015 Annual Report Download - page 150
Download and view the complete annual report
Please find page 150 of the 2015 Toyota annual report below. You can navigate through the pages in the report by either clicking on the pages listed below, or by using the keyword search tool below to find specific information within the annual report.-
 1
1 -
2
-
3
-
4
-
5
-
6
-
7
-
8
-
9
-
10
-
11
-
12
-
13
-
14
-
15
-
16
-
17
-
18
-
19
-
20
-
21
-
22
-
23
-
24
-
25
-
26
-
27
-
28
-
29
-
30
-
31
-
32
-
33
-
34
-
35
-
36
-
37
-
38
-
39
-
40
-
41
-
42
-
43
-
44
-
45
-
46
-
47
-
48
-
49
-
50
-
51
-
52
-
53
-
54
-
55
-
56
-
57
-
58
-
59
-
60
-
61
-
62
-
63
-
64
-
65
-
66
-
67
-
68
-
69
-
70
-
71
-
72
-
73
-
74
-
75
-
76
-
77
-
78
-
79
-
80
-
81
-
82
-
83
-
84
-
85
-
86
-
87
-
88
-
89
-
90
-
91
-
92
-
93
-
94
-
95
-
96
-
97
-
98
-
99
-
100
-
101
-
102
-
103
-
104
-
105
-
106
-
107
-
108
-
109
-
110
-
111
-
112
-
113
-
114
-
115
-
116
-
117
-
118
-
119
-
120
-
121
-
122
-
123
-
124
-
125
-
126
-
127
-
128
-
129
-
130
-
131
-
132
-
133
-
134
-
135
-
136
-
137
-
138
-
139
-
 140
140 -
 141
141 -
 142
142 -
 143
143 -
 144
144 -
 145
145 -
 146
146 -
 147
147 -
 148
148 -
 149
149 -
 150
150 -
 151
151 -
 152
152 -
 153
153 -
 154
154 -
 155
155 -
 156
156 -
 157
157 -
 158
158 -
 159
159 -
 160
160 -
161
-
162
-
163
-
164
-
165
-
166
-
167
-
168
-
169
-
170
-
171
-
172
-
173
-
174
-
175
-
176
-
177
-
178
-
179
-
180
-
181
-
182
-
183
-
184
-
185
-
186
-
187
-
188
-
189
-
190
-
191
-
192
-
193
-
194
-
195
-
196
-
197
-
198
-
199
-
200
-
201
-
202
-
203
-
204
-
205
-
206
-
207
-
208
-
209
-
210
-
211
-
212
-
213
-
214
-
215
-
216
-
217
-
218
-
219
-
220
-
221
-
222
-
223
-
224
-
225
-
226
-
227
-
228
 |
 |

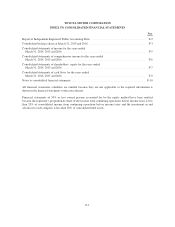
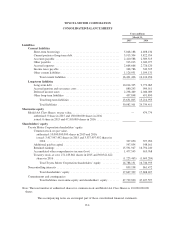
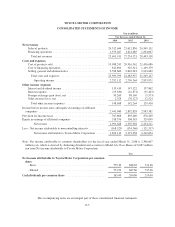
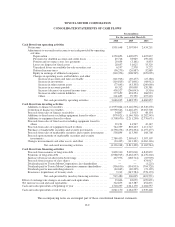
TOYOTA MOTOR CORPORATION
CONSOLIDATED STATEMENTS OF CASH FLOWS
Yen in millions
For the years ended March 31,
2014 2015 2016
Cash flows from operating activities
Net income ................................................. 1,991,648 2,307,904 2,434,211
Adjustments to reconcile net income to net cash provided by operating
activities
Depreciation ............................................ 1,250,853 1,409,075 1,625,837
Provision for doubtful accounts and credit losses ............... 49,718 78,969 159,265
Pension and severance costs, less payments ................... 20,654 (3,161) 8,833
Losses on disposal of fixed assets ........................... 28,657 31,625 33,329
Unrealized losses on available-for-sale securities, net ............ 6,197 2,578 9,272
Deferred income taxes .................................... (56,279) (26,887) 32,889
Equity in earnings of affiliated companies .................... (318,376) (308,545) (329,099)
Changes in operating assets and liabilities, and other
Increase in accounts and notes receivable ................. (121,926) (69,477) (25,180)
Increase in inventories ................................ (110,819) (171,001) (68,912)
Increase in other current assets ......................... (77,645) (43,355) (200,669)
Increase in accounts payable ........................... 65,312 150,058 120,381
Increase (decrease) in accrued income taxes ............... 438,527 (246,043) (5,516)
Increase in other current liabilities ....................... 277,659 494,254 368,923
Other .............................................. 201,855 79,759 297,293
Net cash provided by operating activities ............. 3,646,035 3,685,753 4,460,857
Cash flows from investing activities
Additions to finance receivables ................................ (11,953,064) (13,126,596) (13,549,278)
Collection of finance receivables ................................ 10,990,546 12,426,475 13,067,700
Proceeds from sales of finance receivables ........................ 34,807 23,913 48,154
Additions to fixed assets excluding equipment leased to others ........ (970,021) (1,146,318) (1,282,545)
Additions to equipment leased to others .......................... (1,708,670) (2,211,250) (2,776,671)
Proceeds from sales of fixed assets excluding equipment leased to
others ................................................... 39,191 41,547 42,147
Proceeds from sales of equipment leased to others .................. 744,339 803,423 1,111,727
Purchases of marketable securities and security investments .......... (4,738,278) (3,194,294) (2,197,477)
Proceeds from sales of marketable securities and security investments . . 538,894 113,348 108,708
Proceeds upon maturity of marketable securities and security
investments ............................................... 2,780,433 2,569,653 3,307,107
Changes in investments and other assets, and other ................. (94,425) (113,391) (1,062,116)
Net cash used in investing activities ................. (4,336,248) (3,813,490) (3,182,544)
Cash flows from financing activities
Proceeds from issuance of long-term debt ......................... 3,890,310 5,029,018 4,845,872
Payments of long-term debt .................................... (2,988,923) (3,462,237) (4,176,202)
Increase (decrease) in short-term borrowings ...................... 467,976 (288,724) (10,903)
Proceeds from issuance of class shares ........................... — — 474,917
Dividends paid to Toyota Motor Corporation class shareholders ....... — — (1,225)
Dividends paid to Toyota Motor Corporation common shareholders .... (396,030) (554,933) (704,728)
Dividends paid to noncontrolling interests ........................ (63,065) (69,295) (73,129)
Reissuance (repurchase) of treasury stock ......................... 9,212 (347,784) (778,173)
Net cash provided by (used in) financing activities ...... 919,480 306,045 (423,571)
Effect of exchange rate changes on cash and cash equivalents ............. 93,606 65,079 (199,871)
Net increase in cash and cash equivalents ............................. 322,873 243,387 654,871
Cash and cash equivalents at beginning of year ........................ 1,718,297 2,041,170 2,284,557
Cash and cash equivalents at end of year .............................. 2,041,170 2,284,557 2,939,428
The accompanying notes are an integral part of these consolidated financial statements.
F-9