Toyota 2015 Annual Report Download - page 211
Download and view the complete annual report
Please find page 211 of the 2015 Toyota annual report below. You can navigate through the pages in the report by either clicking on the pages listed below, or by using the keyword search tool below to find specific information within the annual report.-
 1
1 -
2
-
3
-
4
-
5
-
6
-
7
-
8
-
9
-
10
-
11
-
12
-
13
-
14
-
15
-
16
-
17
-
18
-
19
-
20
-
21
-
22
-
23
-
24
-
25
-
26
-
27
-
28
-
29
-
30
-
31
-
32
-
33
-
34
-
35
-
36
-
37
-
38
-
39
-
40
-
41
-
42
-
43
-
44
-
45
-
46
-
47
-
48
-
49
-
50
-
51
-
52
-
53
-
54
-
55
-
56
-
57
-
58
-
59
-
60
-
61
-
62
-
63
-
64
-
65
-
66
-
67
-
68
-
69
-
70
-
71
-
72
-
73
-
74
-
75
-
76
-
77
-
78
-
79
-
80
-
81
-
82
-
83
-
84
-
85
-
86
-
87
-
88
-
89
-
90
-
91
-
92
-
93
-
94
-
95
-
96
-
97
-
98
-
99
-
100
-
101
-
102
-
103
-
104
-
105
-
106
-
107
-
108
-
109
-
110
-
111
-
112
-
113
-
114
-
115
-
116
-
117
-
118
-
119
-
120
-
121
-
122
-
123
-
124
-
125
-
126
-
127
-
128
-
129
-
130
-
131
-
132
-
133
-
134
-
135
-
136
-
137
-
138
-
139
-
140
-
141
-
142
-
143
-
144
-
145
-
146
-
147
-
148
-
149
-
150
-
151
-
152
-
153
-
154
-
155
-
156
-
157
-
158
-
159
-
160
-
161
-
162
-
163
-
164
-
165
-
166
-
167
-
168
-
169
-
170
-
171
-
172
-
173
-
174
-
175
-
176
-
177
-
178
-
179
-
180
-
181
-
182
-
183
-
184
-
185
-
186
-
187
-
188
-
189
-
190
-
191
-
192
-
193
-
194
-
195
-
196
-
197
-
198
-
199
-
200
-
 201
201 -
 202
202 -
 203
203 -
 204
204 -
 205
205 -
 206
206 -
 207
207 -
 208
208 -
 209
209 -
 210
210 -
 211
211 -
 212
212 -
 213
213 -
 214
214 -
 215
215 -
 216
216 -
 217
217 -
 218
218 -
 219
219 -
 220
220 -
 221
221 -
222
-
223
-
224
-
225
-
226
-
227
-
228
 |
 |

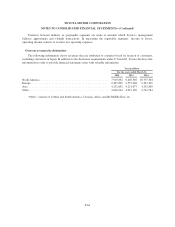
TOYOTA MOTOR CORPORATION
NOTES TO CONSOLIDATED FINANCIAL STATEMENTS—(Continued)
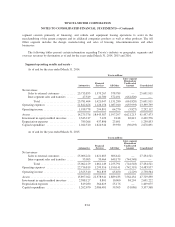
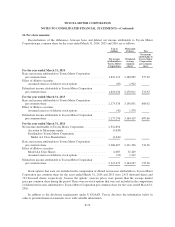
26. Per share amounts:
Reconciliations of the differences between basic and diluted net income attributable to Toyota Motor
Corporation per common share for the years ended March 31, 2014, 2015 and 2016 are as follows:
Yen in
millions
Thousands
of shares Yen
Net income
attributable to
Toyota Motor
Corporation
Weighted-
average
common
shares
Net income
attributable to
Toyota Motor
Corporation
per common
share
For the year ended March 31, 2014
Basic net income attributable to Toyota Motor Corporation
per common share ........................................ 1,823,119 3,168,989 575.30
Effect of dilutive securities
Assumed exercise of dilutive stock options .................. (85) 1,922
Diluted net income attributable to Toyota Motor Corporation
per common share ........................................ 1,823,034 3,170,911 574.92
For the year ended March 31, 2015
Basic net income attributable to Toyota Motor Corporation
per common share ........................................ 2,173,338 3,158,851 688.02
Effect of dilutive securities
Assumed exercise of dilutive stock options .................. (42) 1,578
Diluted net income attributable to Toyota Motor Corporation
per common share ........................................ 2,173,296 3,160,429 687.66
For the year ended March 31, 2016
Net income attributable to Toyota Motor Corporation .............. 2,312,694
Accretion to Mezzanine equity ............................ (3,638)
Dividends to Toyota Motor Corporation
Model AA Class Shareholders ........................... (2,449)
Basic net income attributable to Toyota Motor Corporation
per common share ........................................ 2,306,607 3,111,306 741.36
Effect of dilutive securities
Model AA Class Shares .................................. 6,087 32,429
Assumed exercise of dilutive stock options .................. (21) 1,212
Diluted net income attributable to Toyota Motor Corporation
per common share ........................................ 2,312,673 3,144,947 735.36
Stock options that were not included in the computation of diluted net income attributable to Toyota Motor
Corporation per common share for the years ended March 31, 2014 and 2015 were 2,415 thousand shares and
733 thousand shares, respectively, because the options’ exercise prices were greater than the average market
price per common share during the period. There were no stock options that were not included in the computation
of diluted net income attributable to Toyota Motor Corporation per common share for the years ended March 31,
2016.
In addition to the disclosure requirements under U.S.GAAP, Toyota discloses the information below in
order to provide financial statements users with valuable information.
F-70