Toyota 2015 Annual Report Download - page 198
Download and view the complete annual report
Please find page 198 of the 2015 Toyota annual report below. You can navigate through the pages in the report by either clicking on the pages listed below, or by using the keyword search tool below to find specific information within the annual report.-
 1
1 -
2
-
3
-
4
-
5
-
6
-
7
-
8
-
9
-
10
-
11
-
12
-
13
-
14
-
15
-
16
-
17
-
18
-
19
-
20
-
21
-
22
-
23
-
24
-
25
-
26
-
27
-
28
-
29
-
30
-
31
-
32
-
33
-
34
-
35
-
36
-
37
-
38
-
39
-
40
-
41
-
42
-
43
-
44
-
45
-
46
-
47
-
48
-
49
-
50
-
51
-
52
-
53
-
54
-
55
-
56
-
57
-
58
-
59
-
60
-
61
-
62
-
63
-
64
-
65
-
66
-
67
-
68
-
69
-
70
-
71
-
72
-
73
-
74
-
75
-
76
-
77
-
78
-
79
-
80
-
81
-
82
-
83
-
84
-
85
-
86
-
87
-
88
-
89
-
90
-
91
-
92
-
93
-
94
-
95
-
96
-
97
-
98
-
99
-
100
-
101
-
102
-
103
-
104
-
105
-
106
-
107
-
108
-
109
-
110
-
111
-
112
-
113
-
114
-
115
-
116
-
117
-
118
-
119
-
120
-
121
-
122
-
123
-
124
-
125
-
126
-
127
-
128
-
129
-
130
-
131
-
132
-
133
-
134
-
135
-
136
-
137
-
138
-
139
-
140
-
141
-
142
-
143
-
144
-
145
-
146
-
147
-
148
-
149
-
150
-
151
-
152
-
153
-
154
-
155
-
156
-
157
-
158
-
159
-
160
-
161
-
162
-
163
-
164
-
165
-
166
-
167
-
168
-
169
-
170
-
171
-
172
-
173
-
174
-
175
-
176
-
177
-
178
-
179
-
180
-
181
-
182
-
183
-
184
-
185
-
186
-
187
-
 188
188 -
 189
189 -
 190
190 -
 191
191 -
 192
192 -
 193
193 -
 194
194 -
 195
195 -
 196
196 -
 197
197 -
 198
198 -
 199
199 -
 200
200 -
 201
201 -
 202
202 -
 203
203 -
 204
204 -
 205
205 -
 206
206 -
 207
207 -
 208
208 -
209
-
210
-
211
-
212
-
213
-
214
-
215
-
216
-
217
-
218
-
219
-
220
-
221
-
222
-
223
-
224
-
225
-
226
-
227
-
228
 |
 |
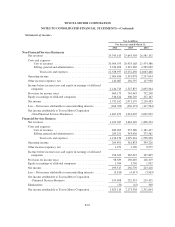
TOYOTA MOTOR CORPORATION
NOTES TO CONSOLIDATED FINANCIAL STATEMENTS—(Continued)
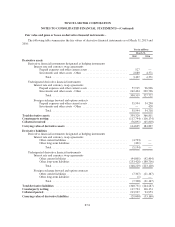
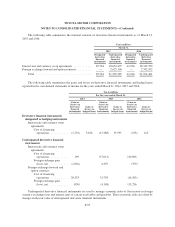
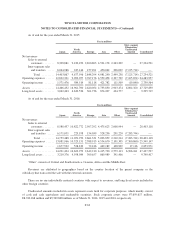
Yen in millions
March 31, 2016
Estimated fair value
Carrying amount Level 1 Level 2 Level 3 Total
Assets (Liabilities)
Cash and cash equivalents ....... 2,939,428 2,023,744 915,684 — 2,939,428
Time deposits ................. 1,032,034 — 1,032,034 — 1,032,034
Total finance receivables, net ..... 13,525,997 — — 13,597,910 13,597,910
Other receivables .............. 451,406 — — 451,406 451,406
Short-term borrowings .......... (4,698,134) — (4,698,134) — (4,698,134)
Long-term debt including the
current portion .............. (13,573,517) — (11,882,343) (1,900,953) (13,783,296)
Cash and cash equivalents and time deposits -
In the normal course of business, substantially all cash and cash equivalents and time deposits are highly
liquid and are carried at amounts which approximate fair value due to its short duration. Cash equivalents and
time deposits include negotiable certificate of deposit measured at fair value on a recurring basis. Where money
market funds produce a daily net asset value in an active market, this value is used to determine the fair value of
the fund investment, and the investment is classified in Level 1. All other types of cash and cash equivalents and
time deposits are classified in Level 2.
Finance receivables, net -
The fair values of finance receivables are estimated by discounting expected cash flows to present value
using internal assumptions, including prepayment speeds, expected credit losses and collateral value. Certain
impaired finance receivables are measured at fair value on a nonrecurring basis based on collateral values.
As unobservable inputs are utilized, finance receivables are classified in Level 3.
Other receivables -
Other receivables are short-term receivables. These receivables are carried at amounts which approximate
fair value, and the difference between the carrying amount and the fair value is not material. These receivables
are classified in Level 3.
Short-term borrowings and long-term debt -
The fair values of short-term borrowings and long-term debt including the current portion, except for
secured loans provided by securitization transactions using special-purpose entities, are estimated based on the
discounted amounts of future cash flows using Toyota’s current borrowing rates for similar liabilities. As these
inputs are observable, these debts are classified in Level 2.
The fair values of the secured loans provided by securitization transactions are estimated based on current
market rates and credit spreads for debt with similar maturities. Internal assumptions including prepayment
speeds and expected credit losses are used to estimate the timing of cash flows to be paid on the underlying
securitized assets. As these valuations utilize unobservable inputs, the secured loans are classified in Level 3. See
note 11 to the consolidated financial statements for information regarding the secured loans.
F-57