Toyota 2015 Annual Report Download - page 190
Download and view the complete annual report
Please find page 190 of the 2015 Toyota annual report below. You can navigate through the pages in the report by either clicking on the pages listed below, or by using the keyword search tool below to find specific information within the annual report.-
 1
1 -
2
-
3
-
4
-
5
-
6
-
7
-
8
-
9
-
10
-
11
-
12
-
13
-
14
-
15
-
16
-
17
-
18
-
19
-
20
-
21
-
22
-
23
-
24
-
25
-
26
-
27
-
28
-
29
-
30
-
31
-
32
-
33
-
34
-
35
-
36
-
37
-
38
-
39
-
40
-
41
-
42
-
43
-
44
-
45
-
46
-
47
-
48
-
49
-
50
-
51
-
52
-
53
-
54
-
55
-
56
-
57
-
58
-
59
-
60
-
61
-
62
-
63
-
64
-
65
-
66
-
67
-
68
-
69
-
70
-
71
-
72
-
73
-
74
-
75
-
76
-
77
-
78
-
79
-
80
-
81
-
82
-
83
-
84
-
85
-
86
-
87
-
88
-
89
-
90
-
91
-
92
-
93
-
94
-
95
-
96
-
97
-
98
-
99
-
100
-
101
-
102
-
103
-
104
-
105
-
106
-
107
-
108
-
109
-
110
-
111
-
112
-
113
-
114
-
115
-
116
-
117
-
118
-
119
-
120
-
121
-
122
-
123
-
124
-
125
-
126
-
127
-
128
-
129
-
130
-
131
-
132
-
133
-
134
-
135
-
136
-
137
-
138
-
139
-
140
-
141
-
142
-
143
-
144
-
145
-
146
-
147
-
148
-
149
-
150
-
151
-
152
-
153
-
154
-
155
-
156
-
157
-
158
-
159
-
160
-
161
-
162
-
163
-
164
-
165
-
166
-
167
-
168
-
169
-
170
-
171
-
172
-
173
-
174
-
175
-
176
-
177
-
178
-
179
-
 180
180 -
 181
181 -
 182
182 -
 183
183 -
 184
184 -
 185
185 -
 186
186 -
 187
187 -
 188
188 -
 189
189 -
 190
190 -
 191
191 -
 192
192 -
 193
193 -
 194
194 -
 195
195 -
 196
196 -
 197
197 -
 198
198 -
 199
199 -
 200
200 -
201
-
202
-
203
-
204
-
205
-
206
-
207
-
208
-
209
-
210
-
211
-
212
-
213
-
214
-
215
-
216
-
217
-
218
-
219
-
220
-
221
-
222
-
223
-
224
-
225
-
226
-
227
-
228
 |
 |

TOYOTA MOTOR CORPORATION
NOTES TO CONSOLIDATED FINANCIAL STATEMENTS—(Continued)
The expected rate of return on plan assets is determined after considering several applicable factors
including, the composition of plan assets held, assumed risks of asset management, historical results of the
returns on plan assets, Toyota’s principal policy for plan asset management, and forecasted market conditions.
Toyota’s policy and objective for plan asset management is to maximize returns on plan assets to meet
future benefit payment requirements under risks which Toyota considers permissible. Asset allocations under the
plan asset management are determined based on plan asset management policies of each plan which are
established to achieve the optimized asset compositions in terms of the long-term overall plan asset management.
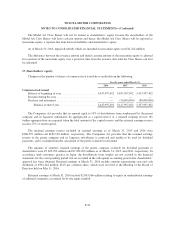
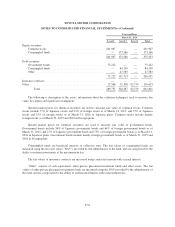
In Japanese plans, excepting equity securities contributed by Toyota, approximately 45% of the plan assets is
invested in equity securities, approximately 30% is invested in debt securities, and the rest of them is invested in
insurance contracts and other products. In Foreign plans, excepting equity securities contributed by Toyota,
approximately 55% of the plan assets is invested in equity securities, approximately 30% is invested in debt
securities, and the rest of them is invested in other products. When actual allocations are not in line with target
allocations, Toyota rebalances its investments in accordance with the policies. Prior to making individual
investments, Toyota performs in-depth assessments of corresponding factors including category of products,
industry type, currencies and liquidity of each potential investment under consideration to mitigate
concentrations of risks such as market risk and foreign currency exchange rate risk. To assess performance of the
investments, Toyota establishes bench mark return rates for each individual investment, combines these
individual bench mark rates based on the asset composition ratios within each asset category, and compares the
combined rates with the corresponding actual return rates on each asset category.
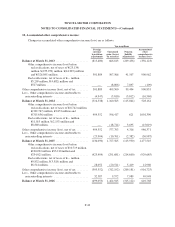
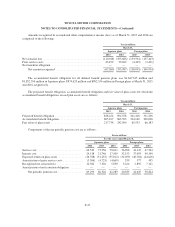
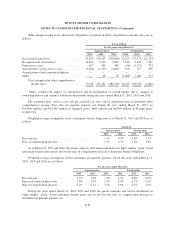
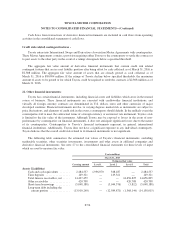
The following table summarizes the fair value of classes of plan assets as of March 31, 2015 and 2016. See
note 27 to the consolidated financial statements for three levels of input which are used to measure fair value.
Japanese plans
Yen in millions
March 31, 2015
Level 1 Level 2 Level 3 Total
Equity securities
Common stocks ....................................... 603,293 — — 603,293
Commingled funds ..................................... — 163,543 — 163,543
603,293 163,543 — 766,836
Debt securities
Government bonds ..................................... 91,348 — — 91,348
Commingled funds ..................................... — 247,261 — 247,261
Other ................................................ — 23,267 233 23,500
91,348 270,528 233 362,109
Insurance contracts ......................................... — 175,068 — 175,068
Other .................................................... 23,549 70,133 50,107 143,789
Total ............................................ 718,190 679,272 50,340 1,447,802
F-49